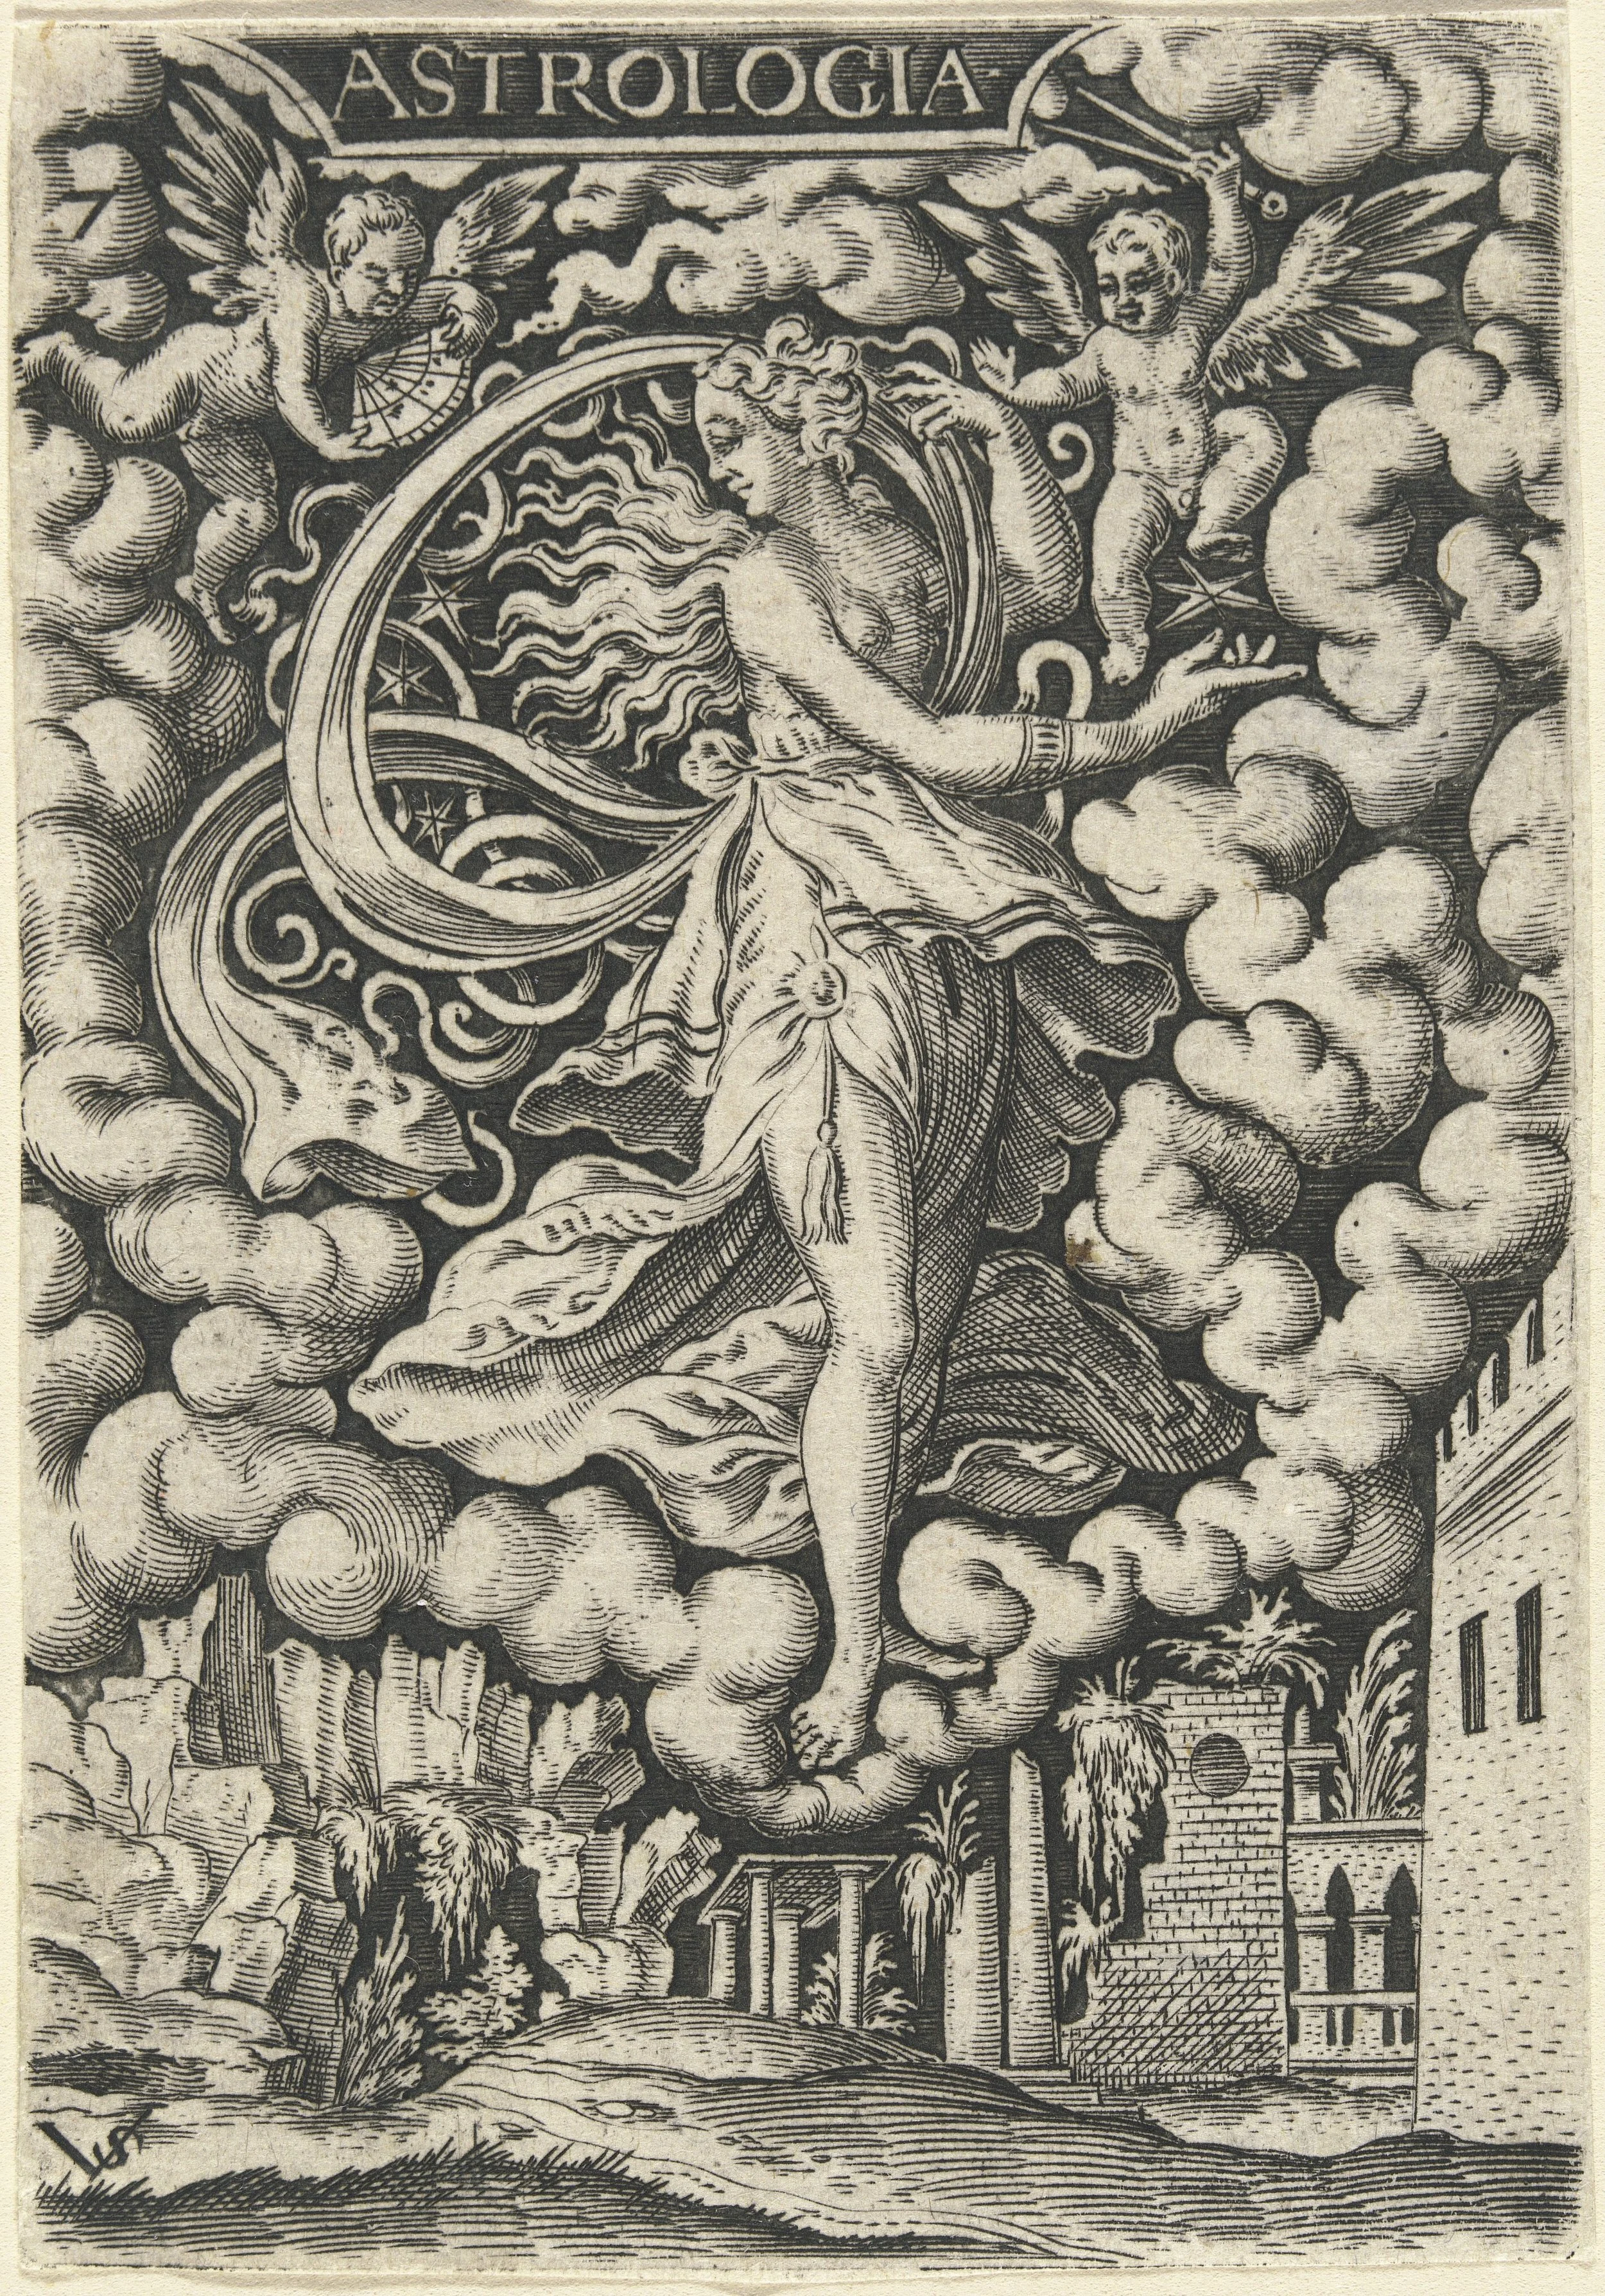
From Earthly Objects to Celestial Time: How The Met Collection’s Highlights Objects Sit Between Human History and Planetary Cycles
Artist, German, 1514 - 1562
This narrative project follows a sample of 213 objects in the Met Collection designated as “Highlights”. These objects were created in years connected to important historical incidents between 1201 and 2022. These objecrs represent 322 years of cultural production.
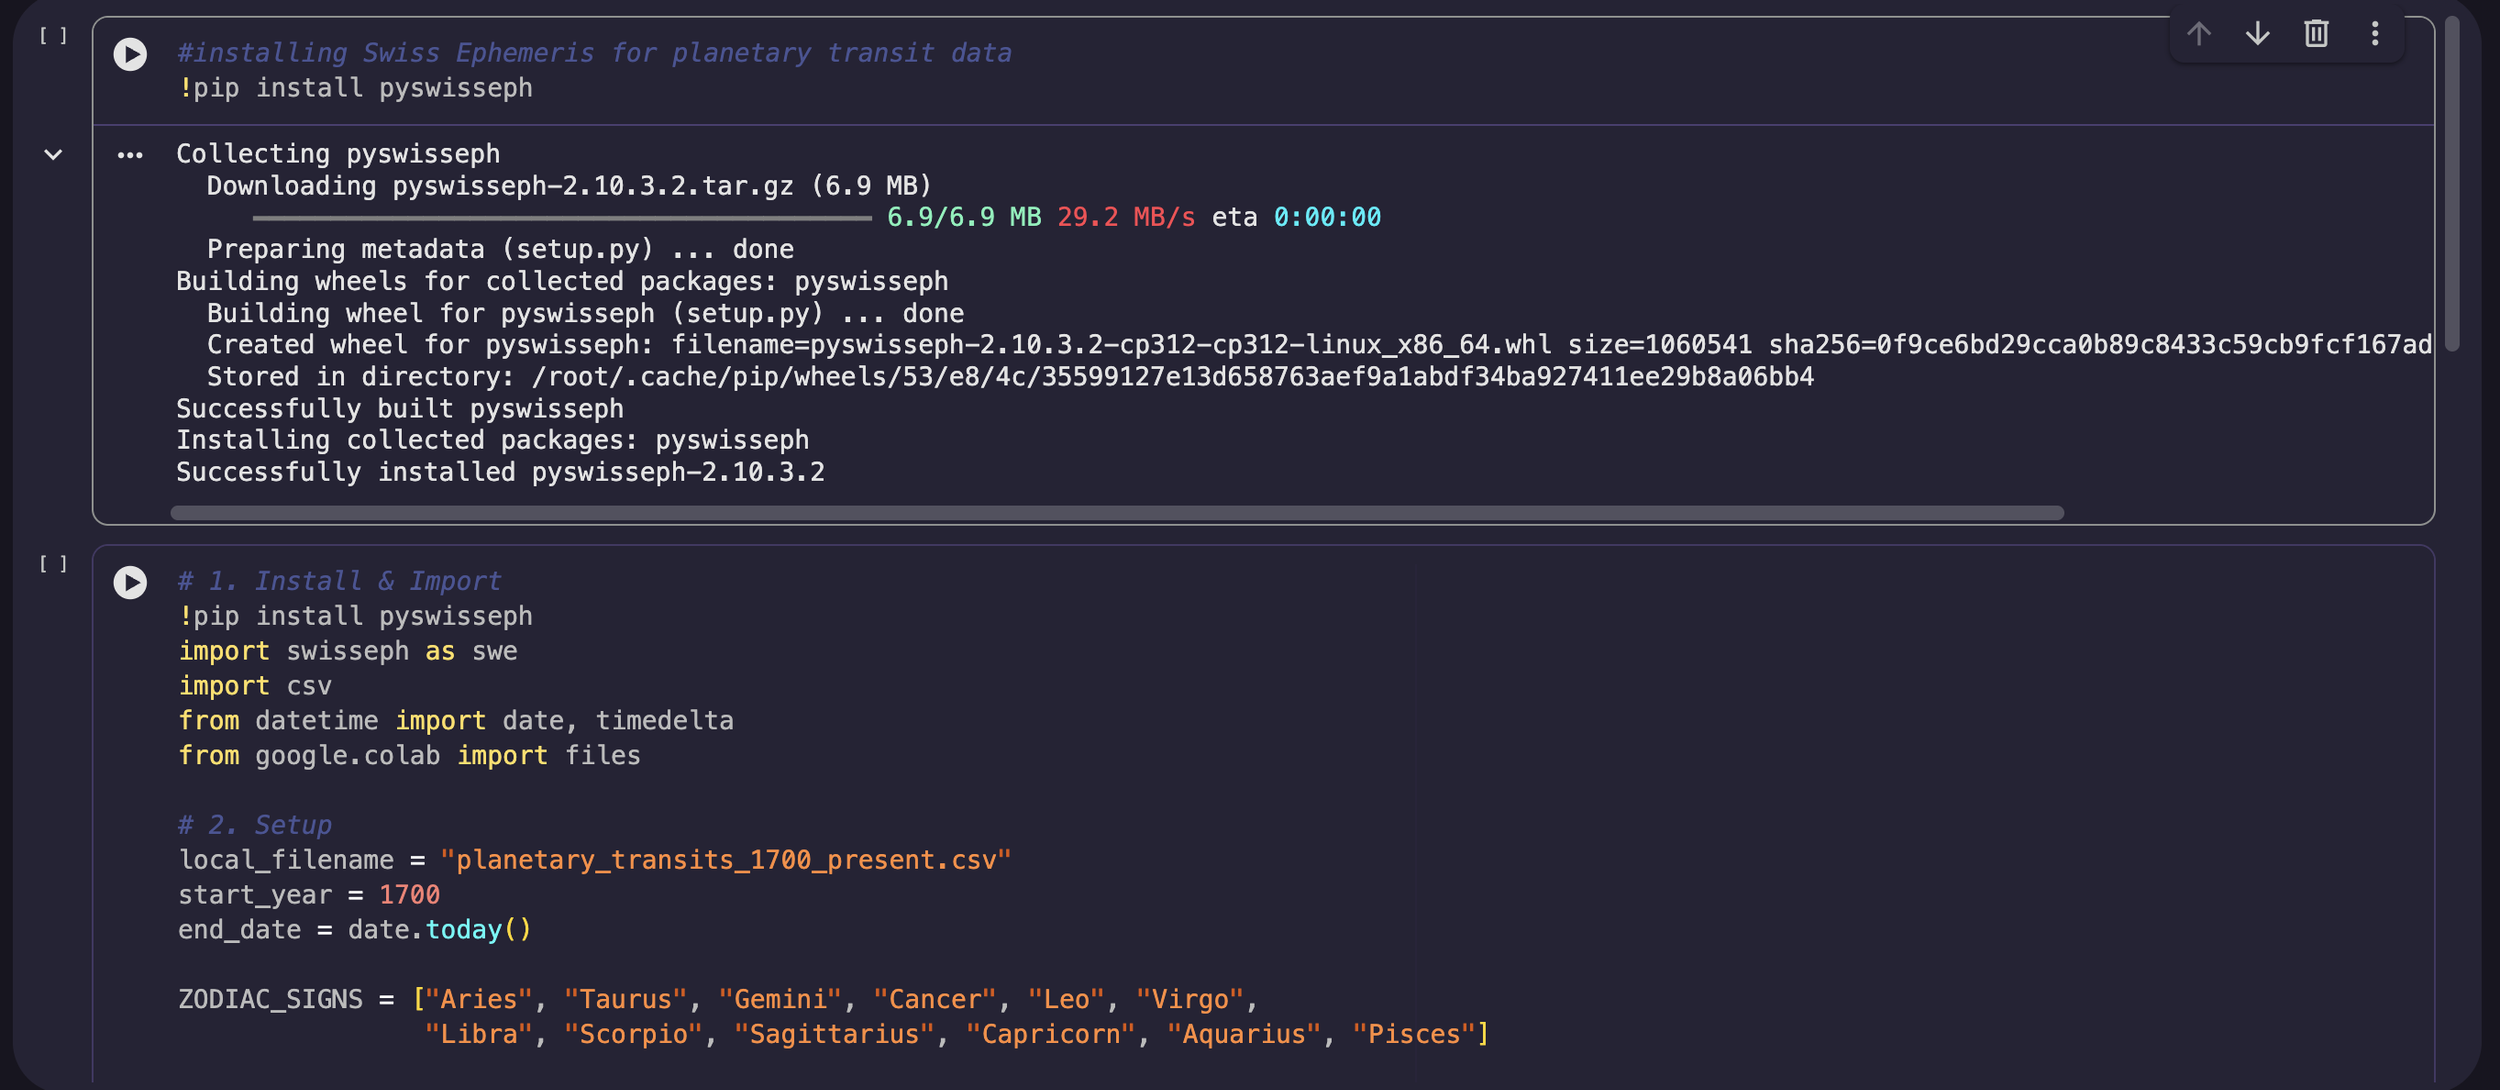
This project was created in conjunction with the Curating Visibility as a possibility of new ways the content team can increase audience engagement and interaction. I used data from the Met API, A World Important Events Dataset from Kaggle, and the Swiss Ephemeris API (used for astrological data).
Tools used:
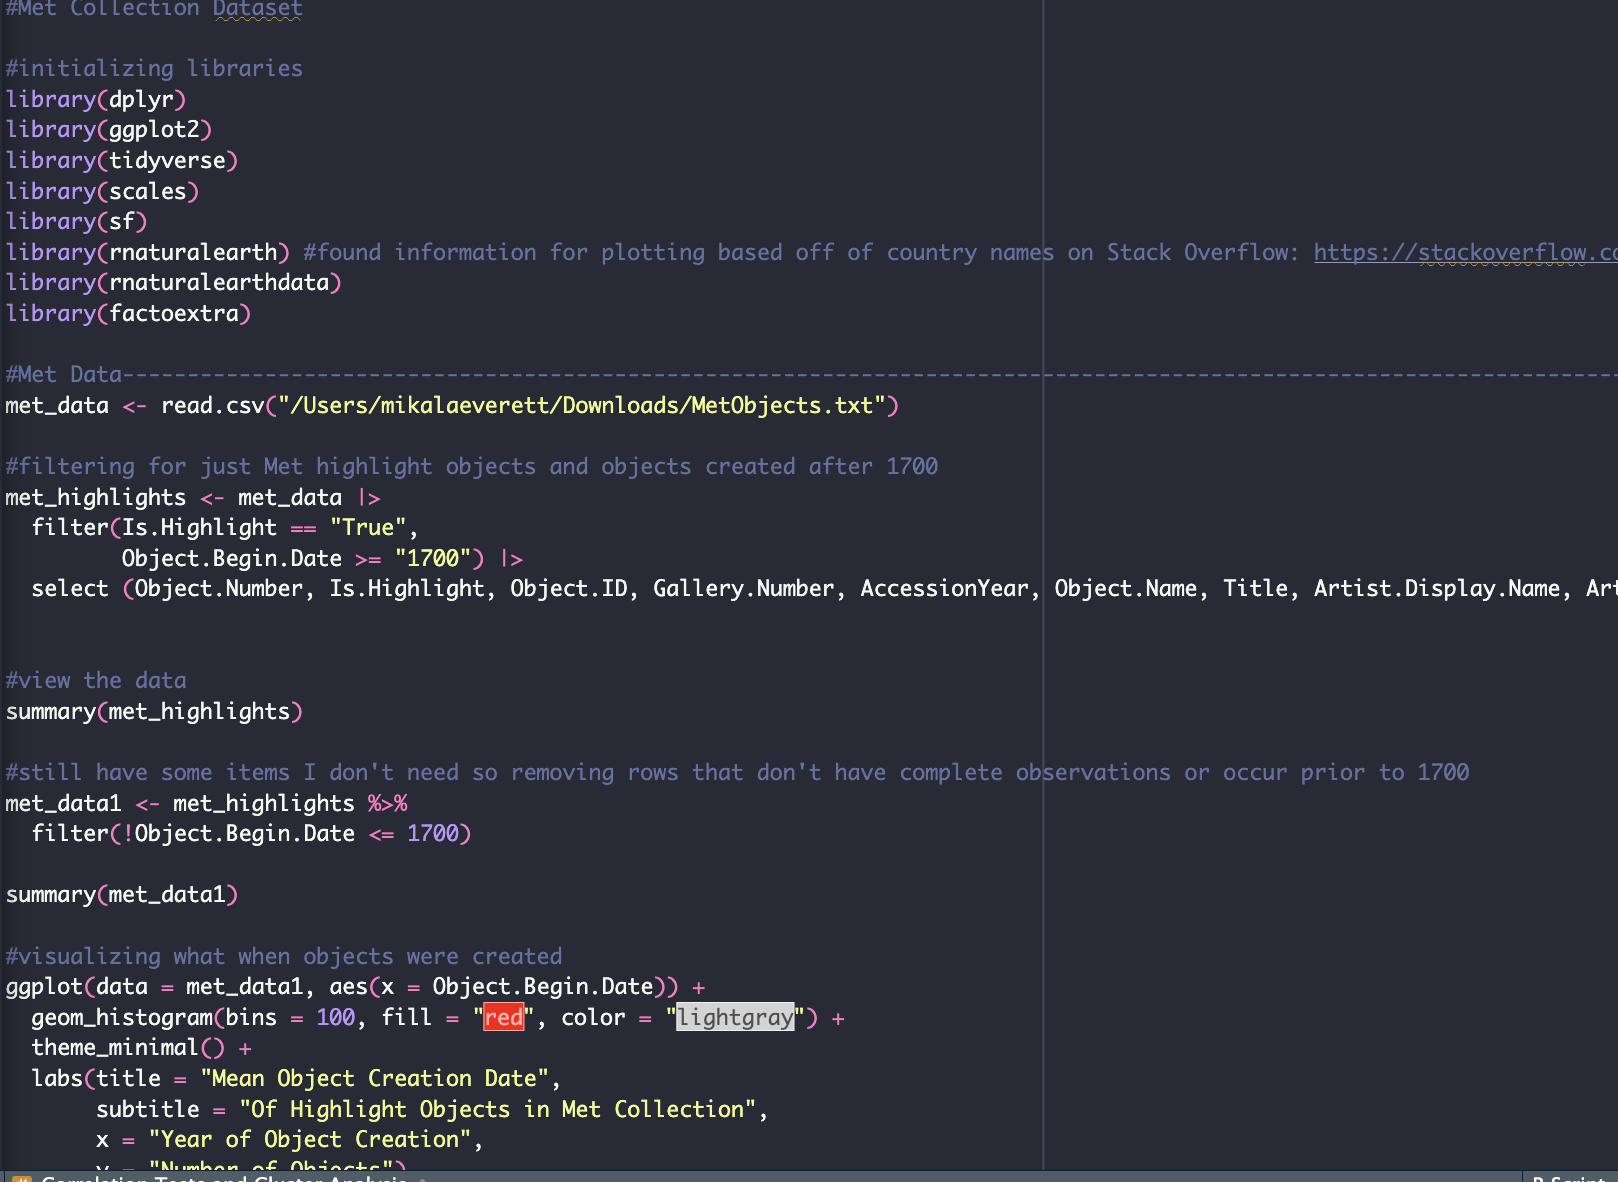
R → cleaning Met API data
Python → combine Met Data, World History Data and astrological data
Javascript and Cursor → build interactive dashboard
Github Pages → host the site
I first pulled the Met API into R and collected objects from the “Is Highlights” column.
I decided to work with objects created after 1700 to reduce the dataset. For variables I pulled in the Object Number, Object ID, Accession Year, Object Name, Title, and Location.
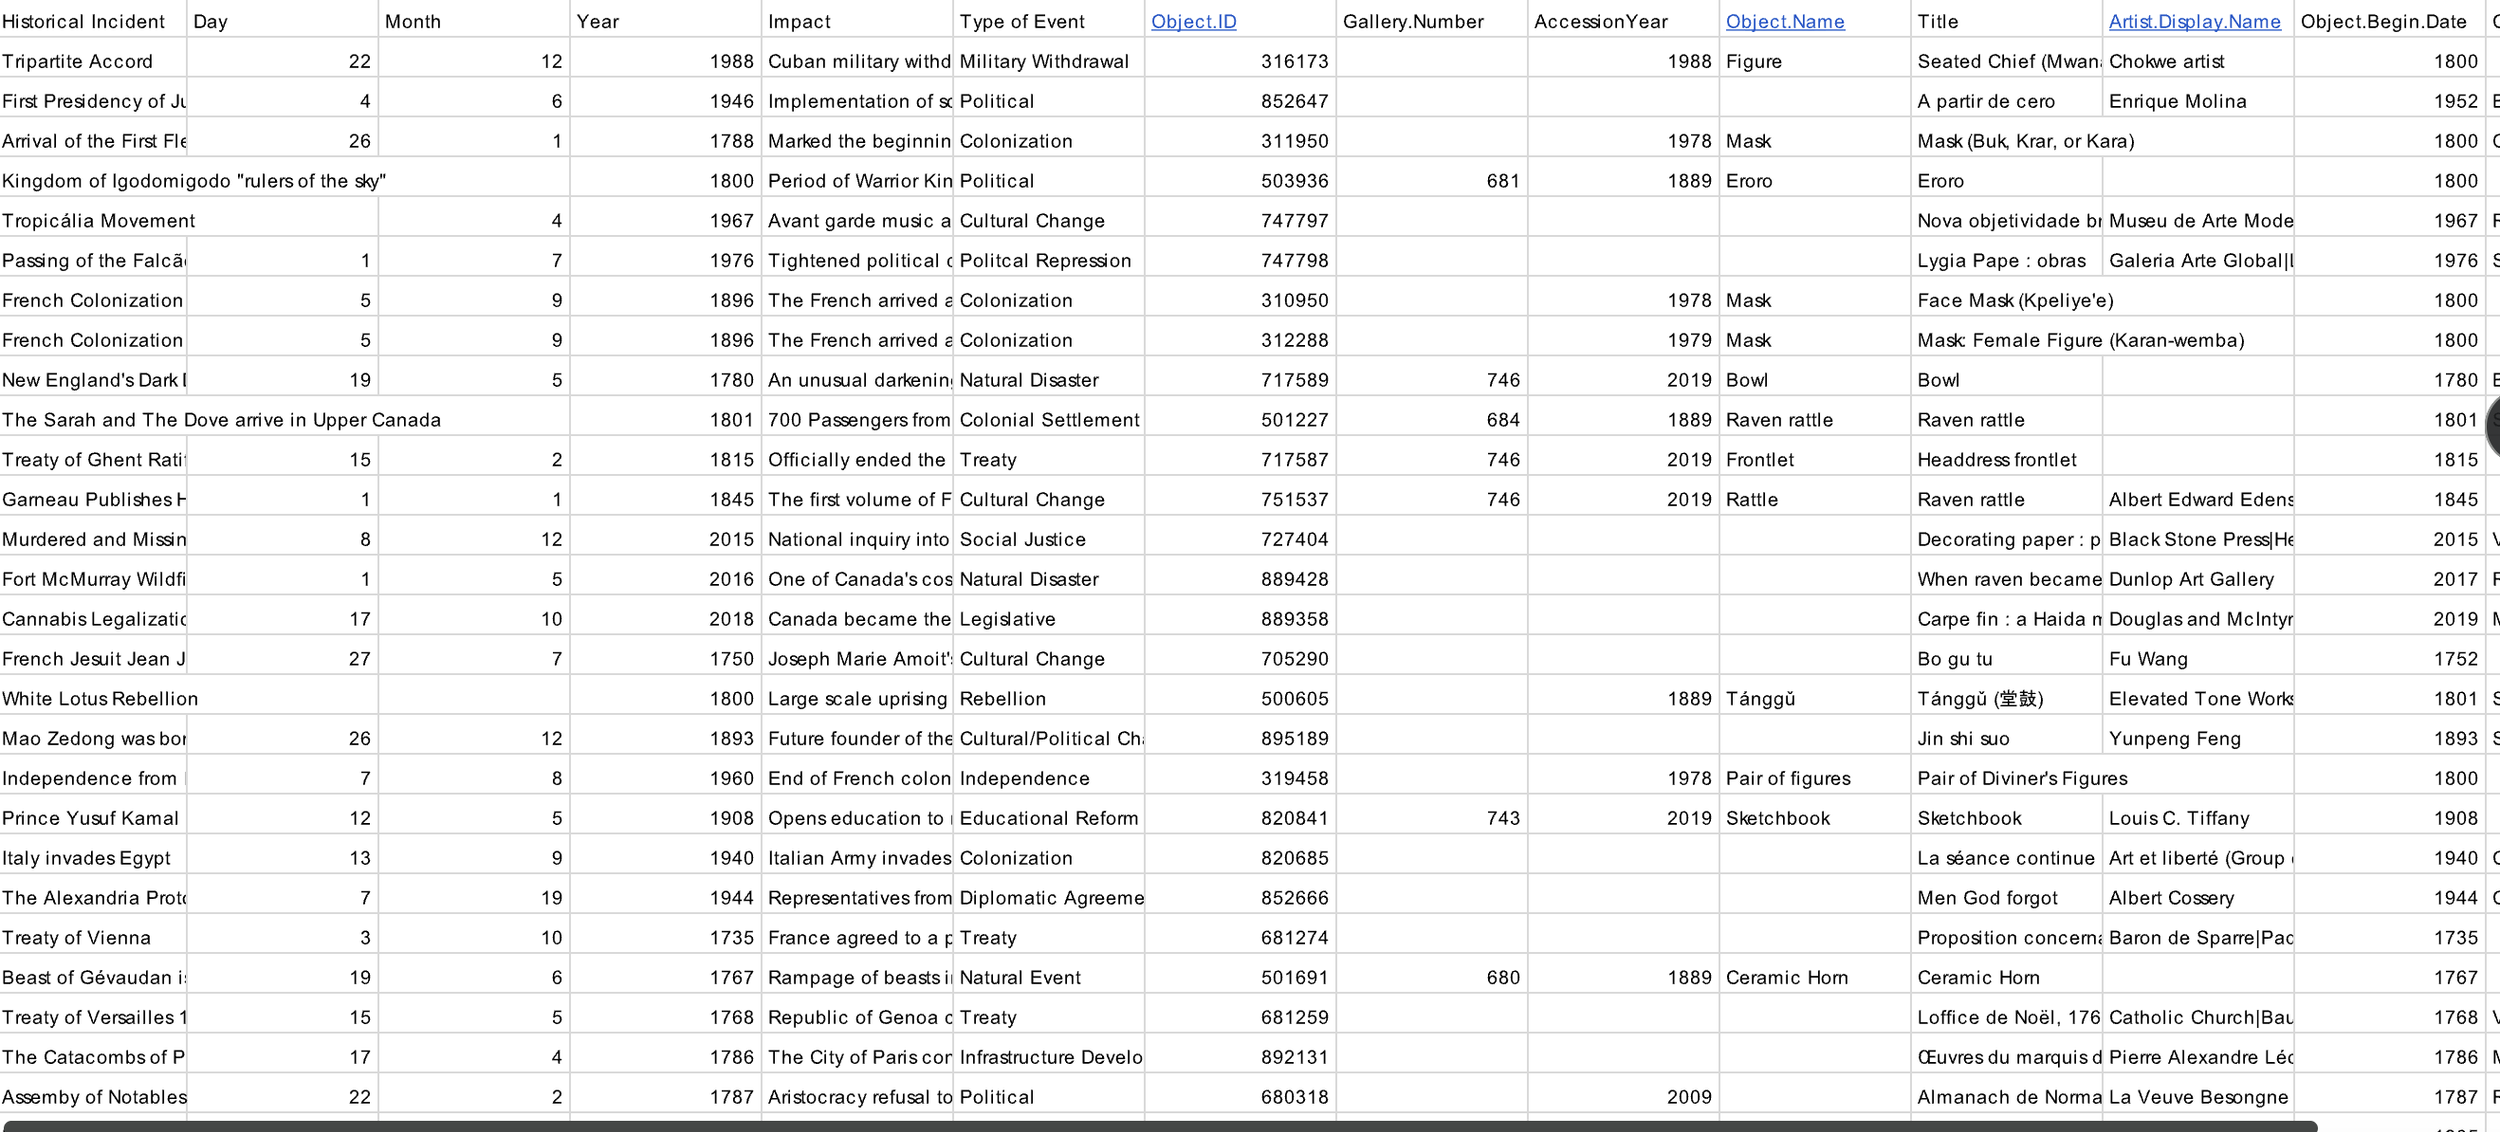
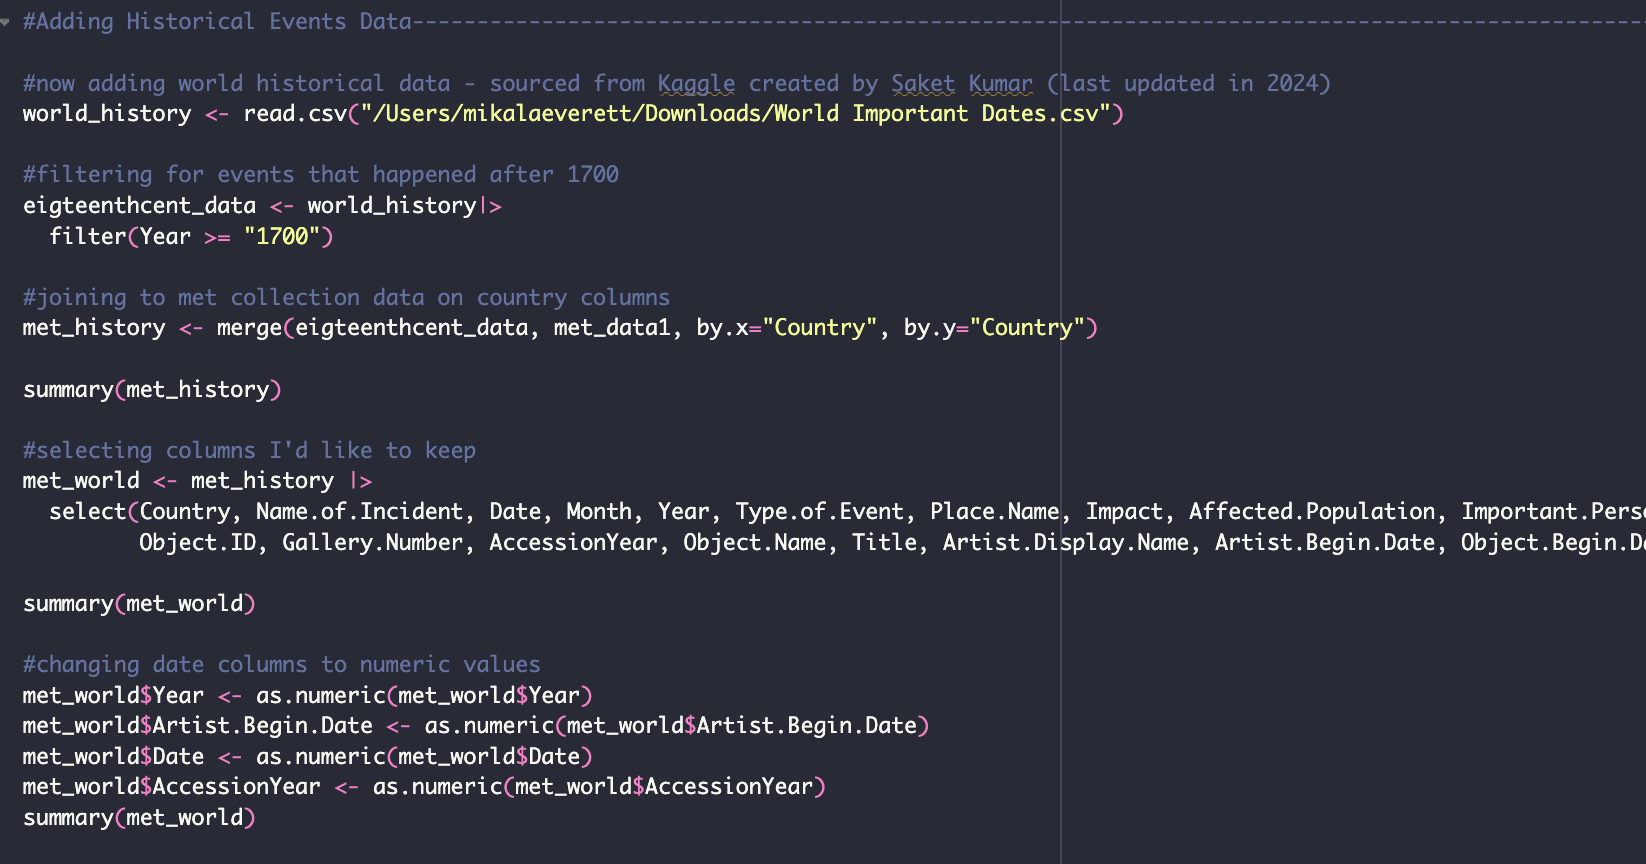
I then added the world history data set and then cleaned the data to keep columns that aligned with the projects needs and merged it with the met objects data. I then changed date columns to numeric values.
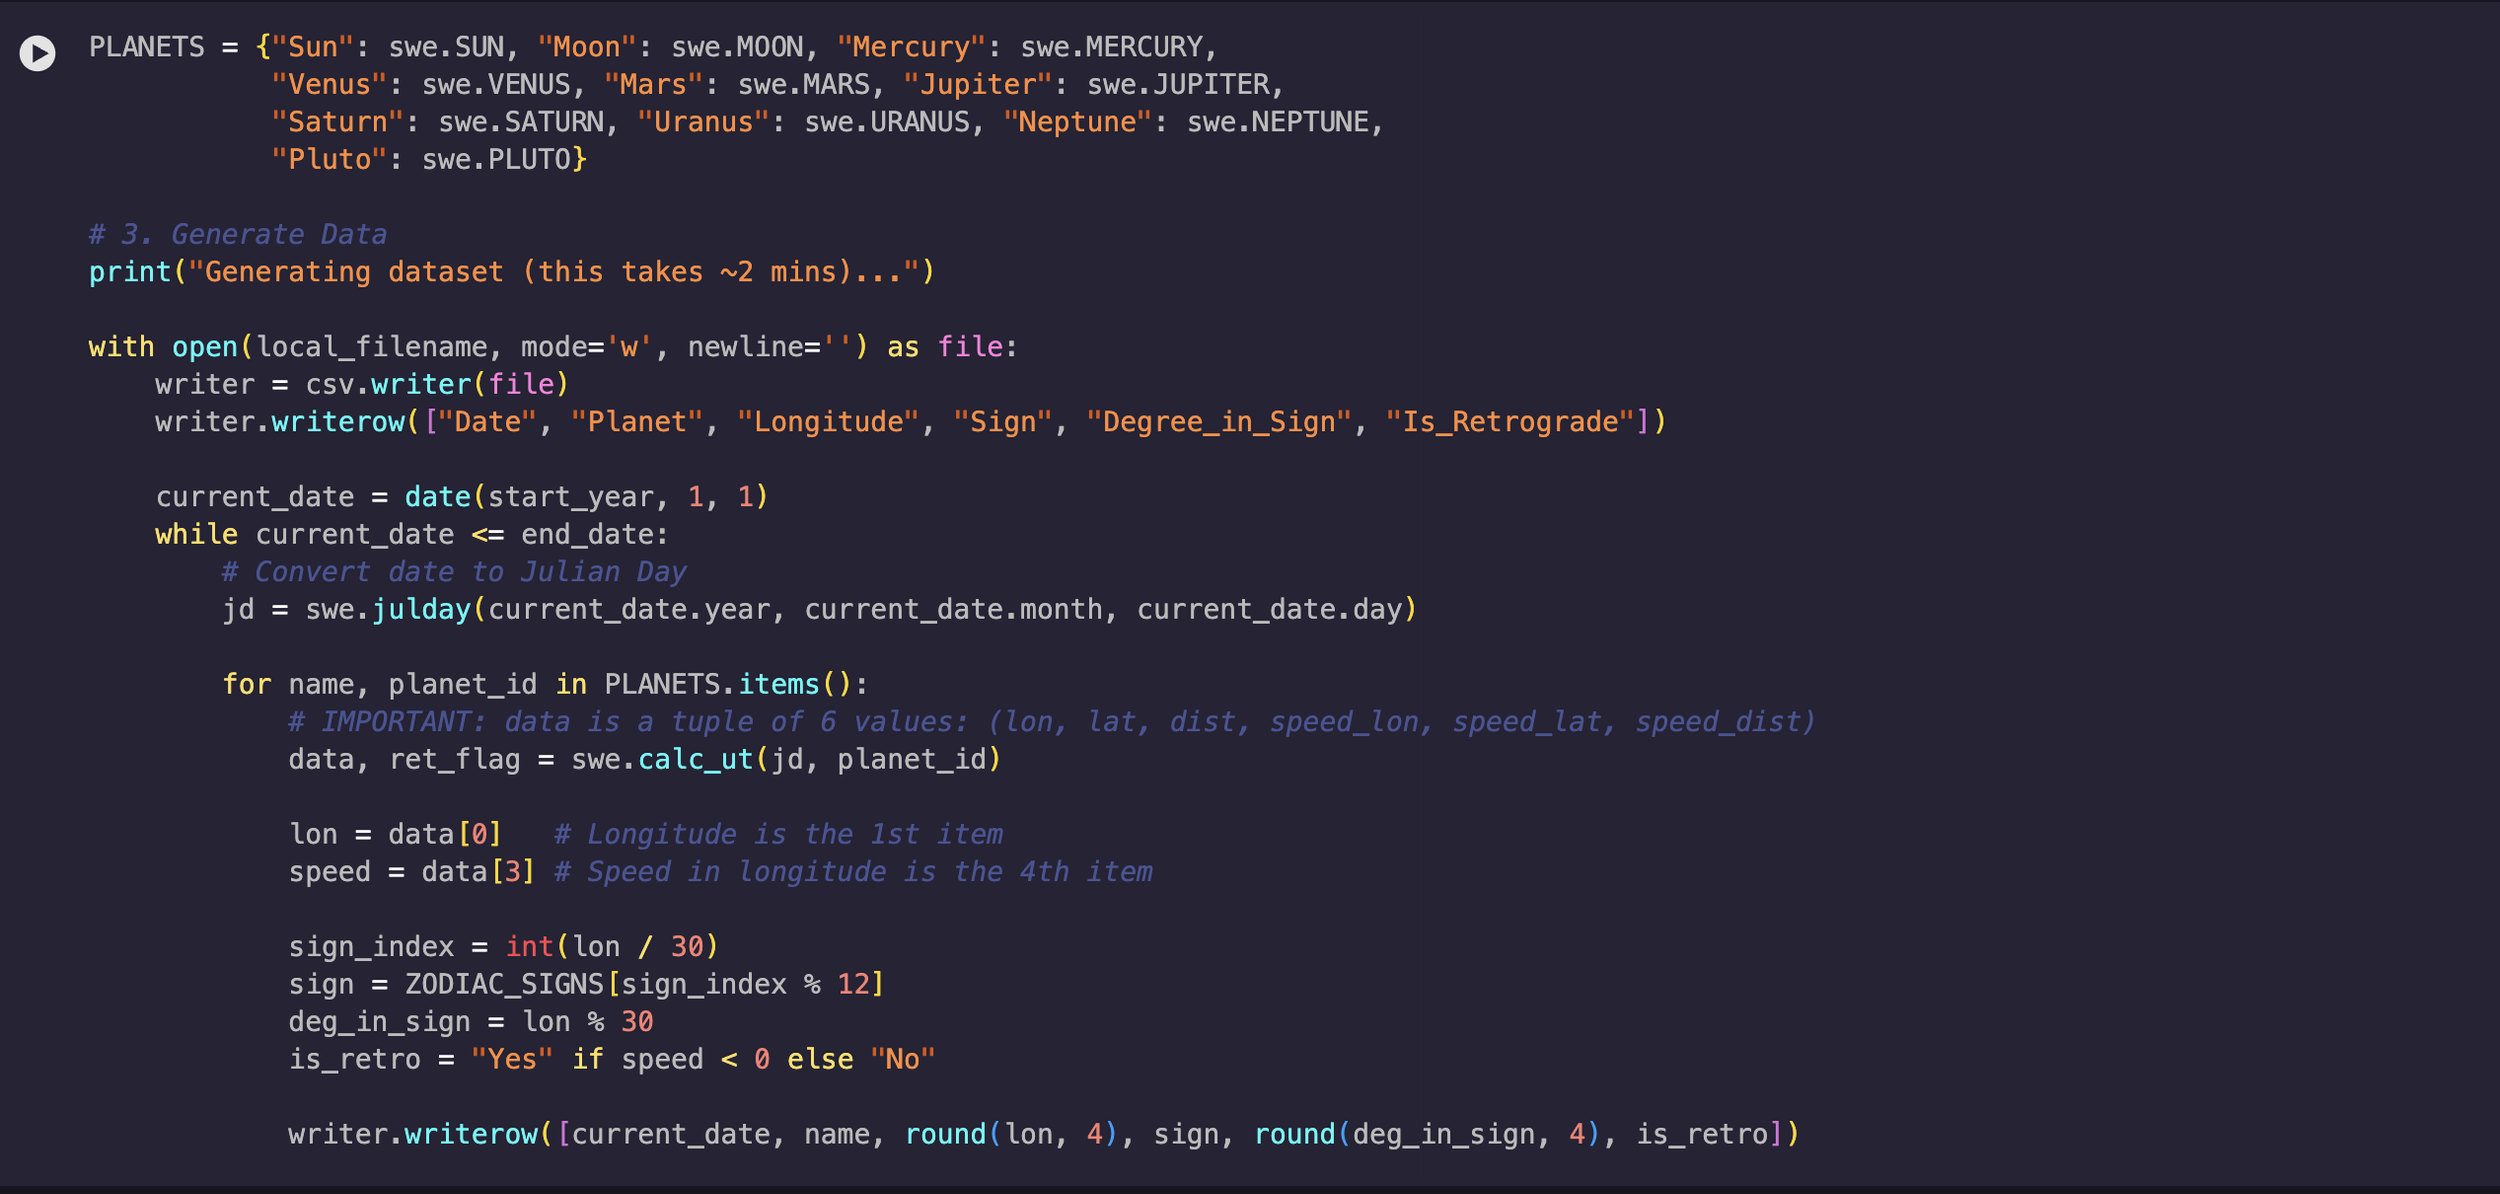
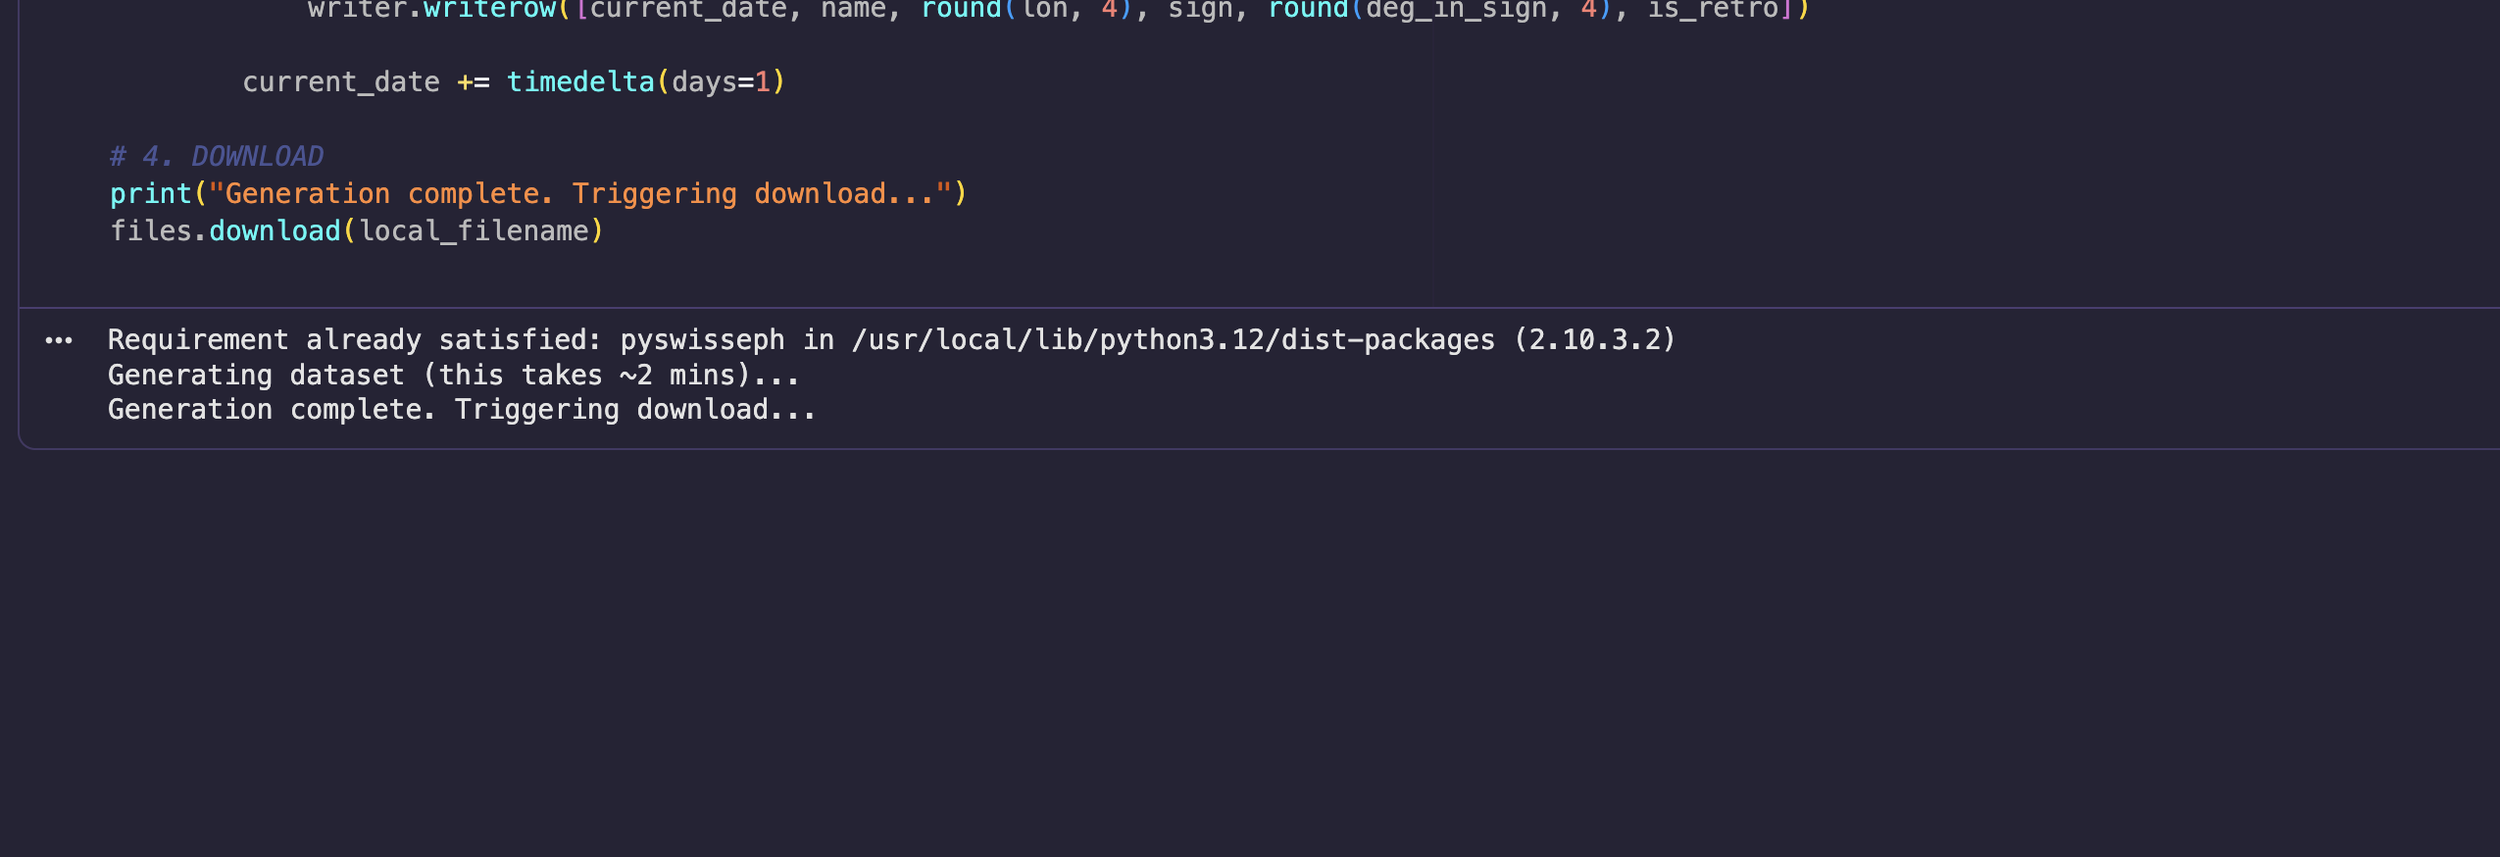
At this point, I needed a cleaner way to combine all three datasets and decided to do this with Python, but first I needed to pull in astrological data from the Swiss Ephemeris API.
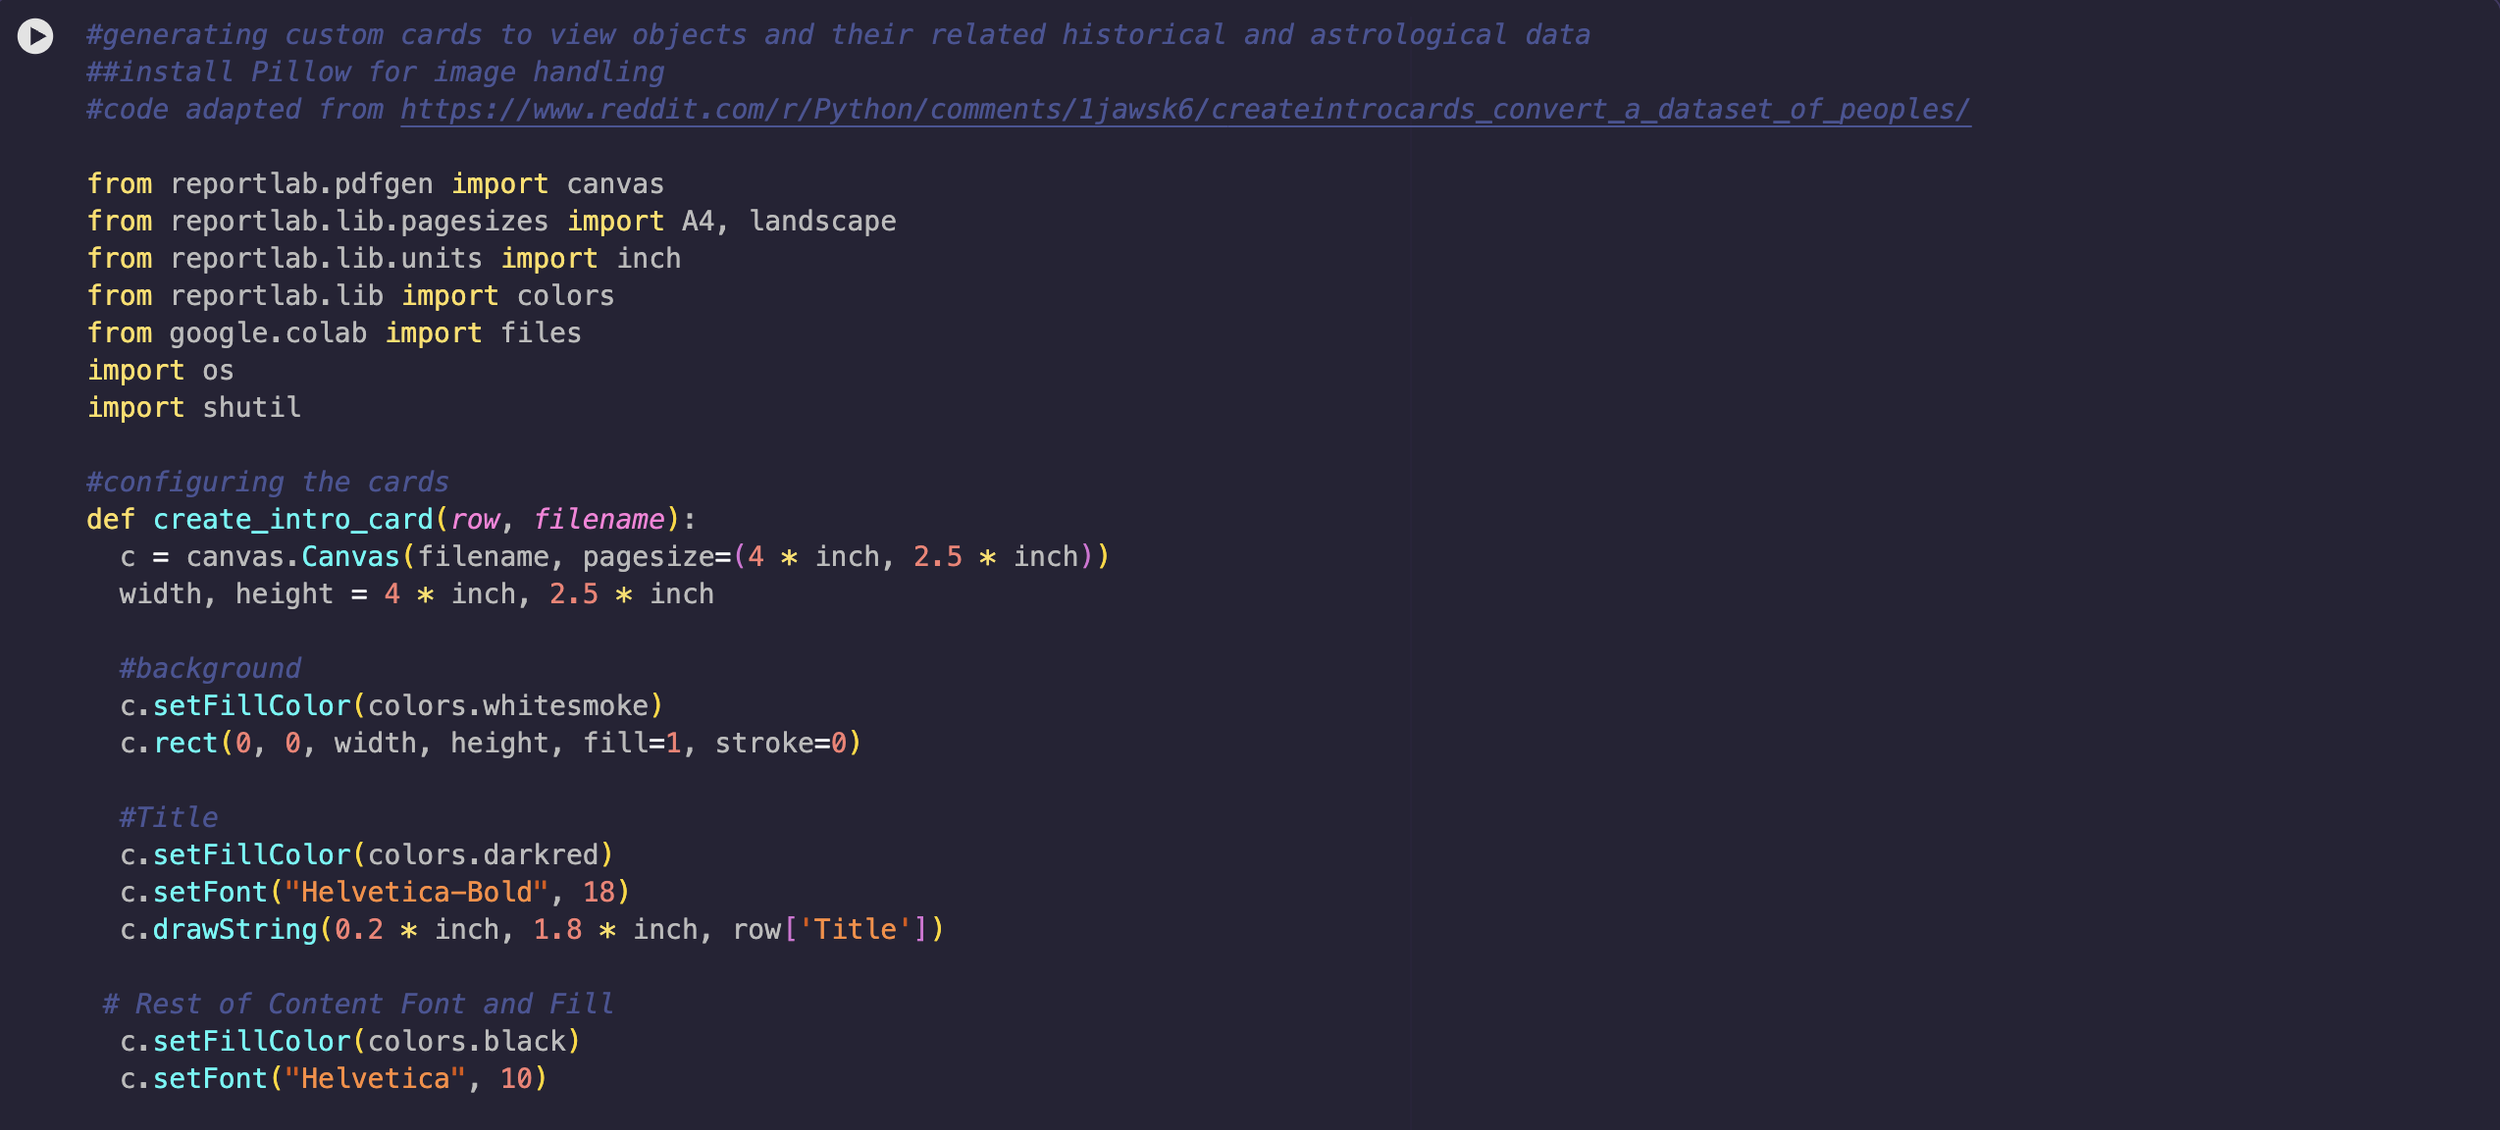
I then combined all three datasets in Python. The next step was to create a script to pull images for the project to show if a user hovered over an object on the interative scrollytelling project.
The data cleaning, preparation and merging took much longer than expected (about four months) so I decided to use Cursor to help me build out the scrollytelling aspect.
I created the base code for the javascript visualizations and had Cursor expand on what I needed the project to do.
I was able to complete the project in time before the fellowship ended after going throgh many iterations with the coding agent.



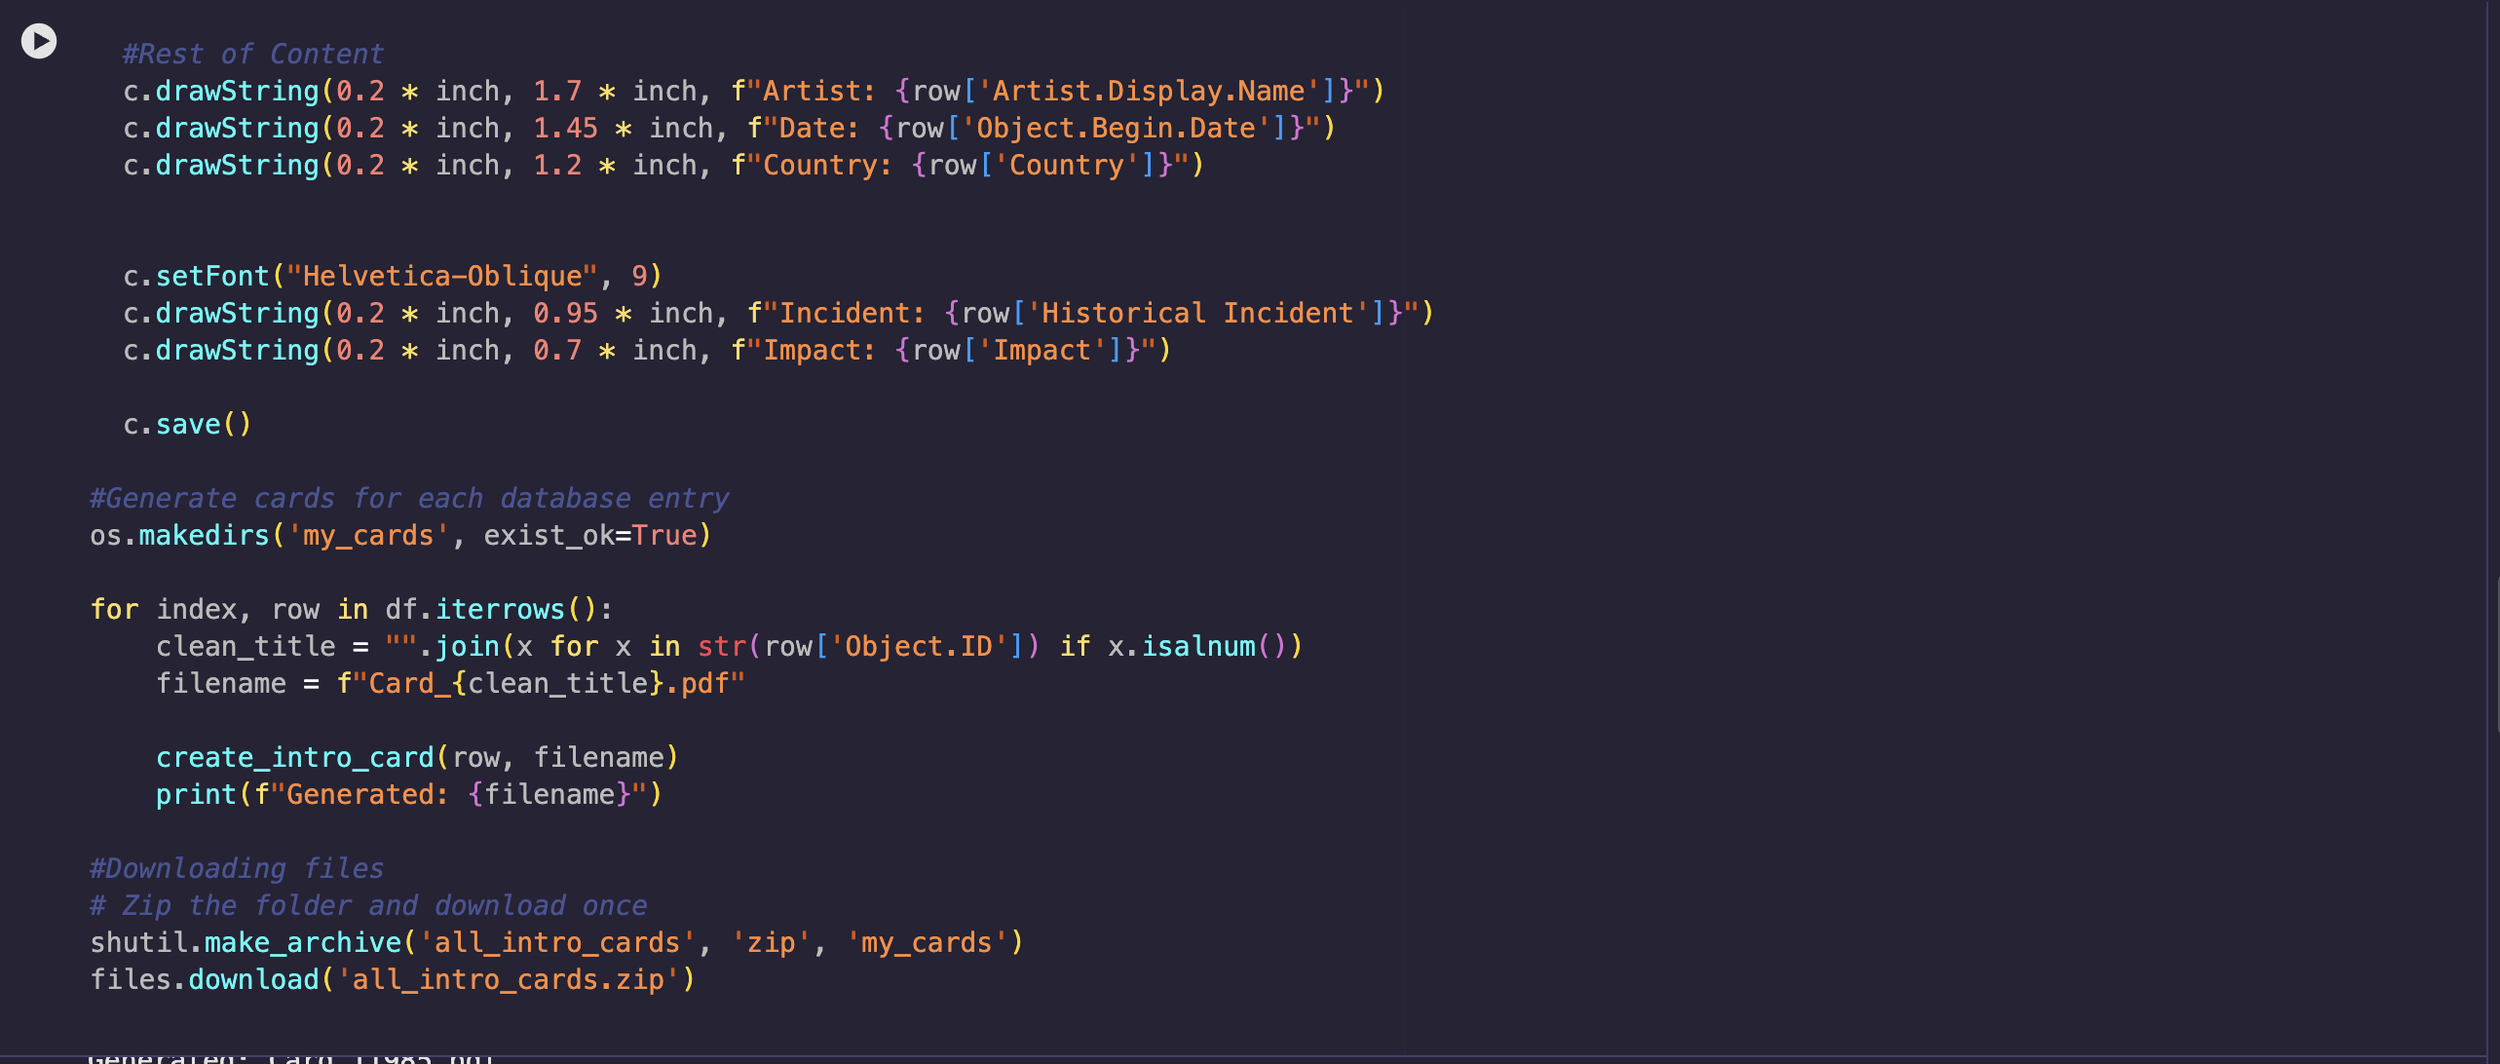
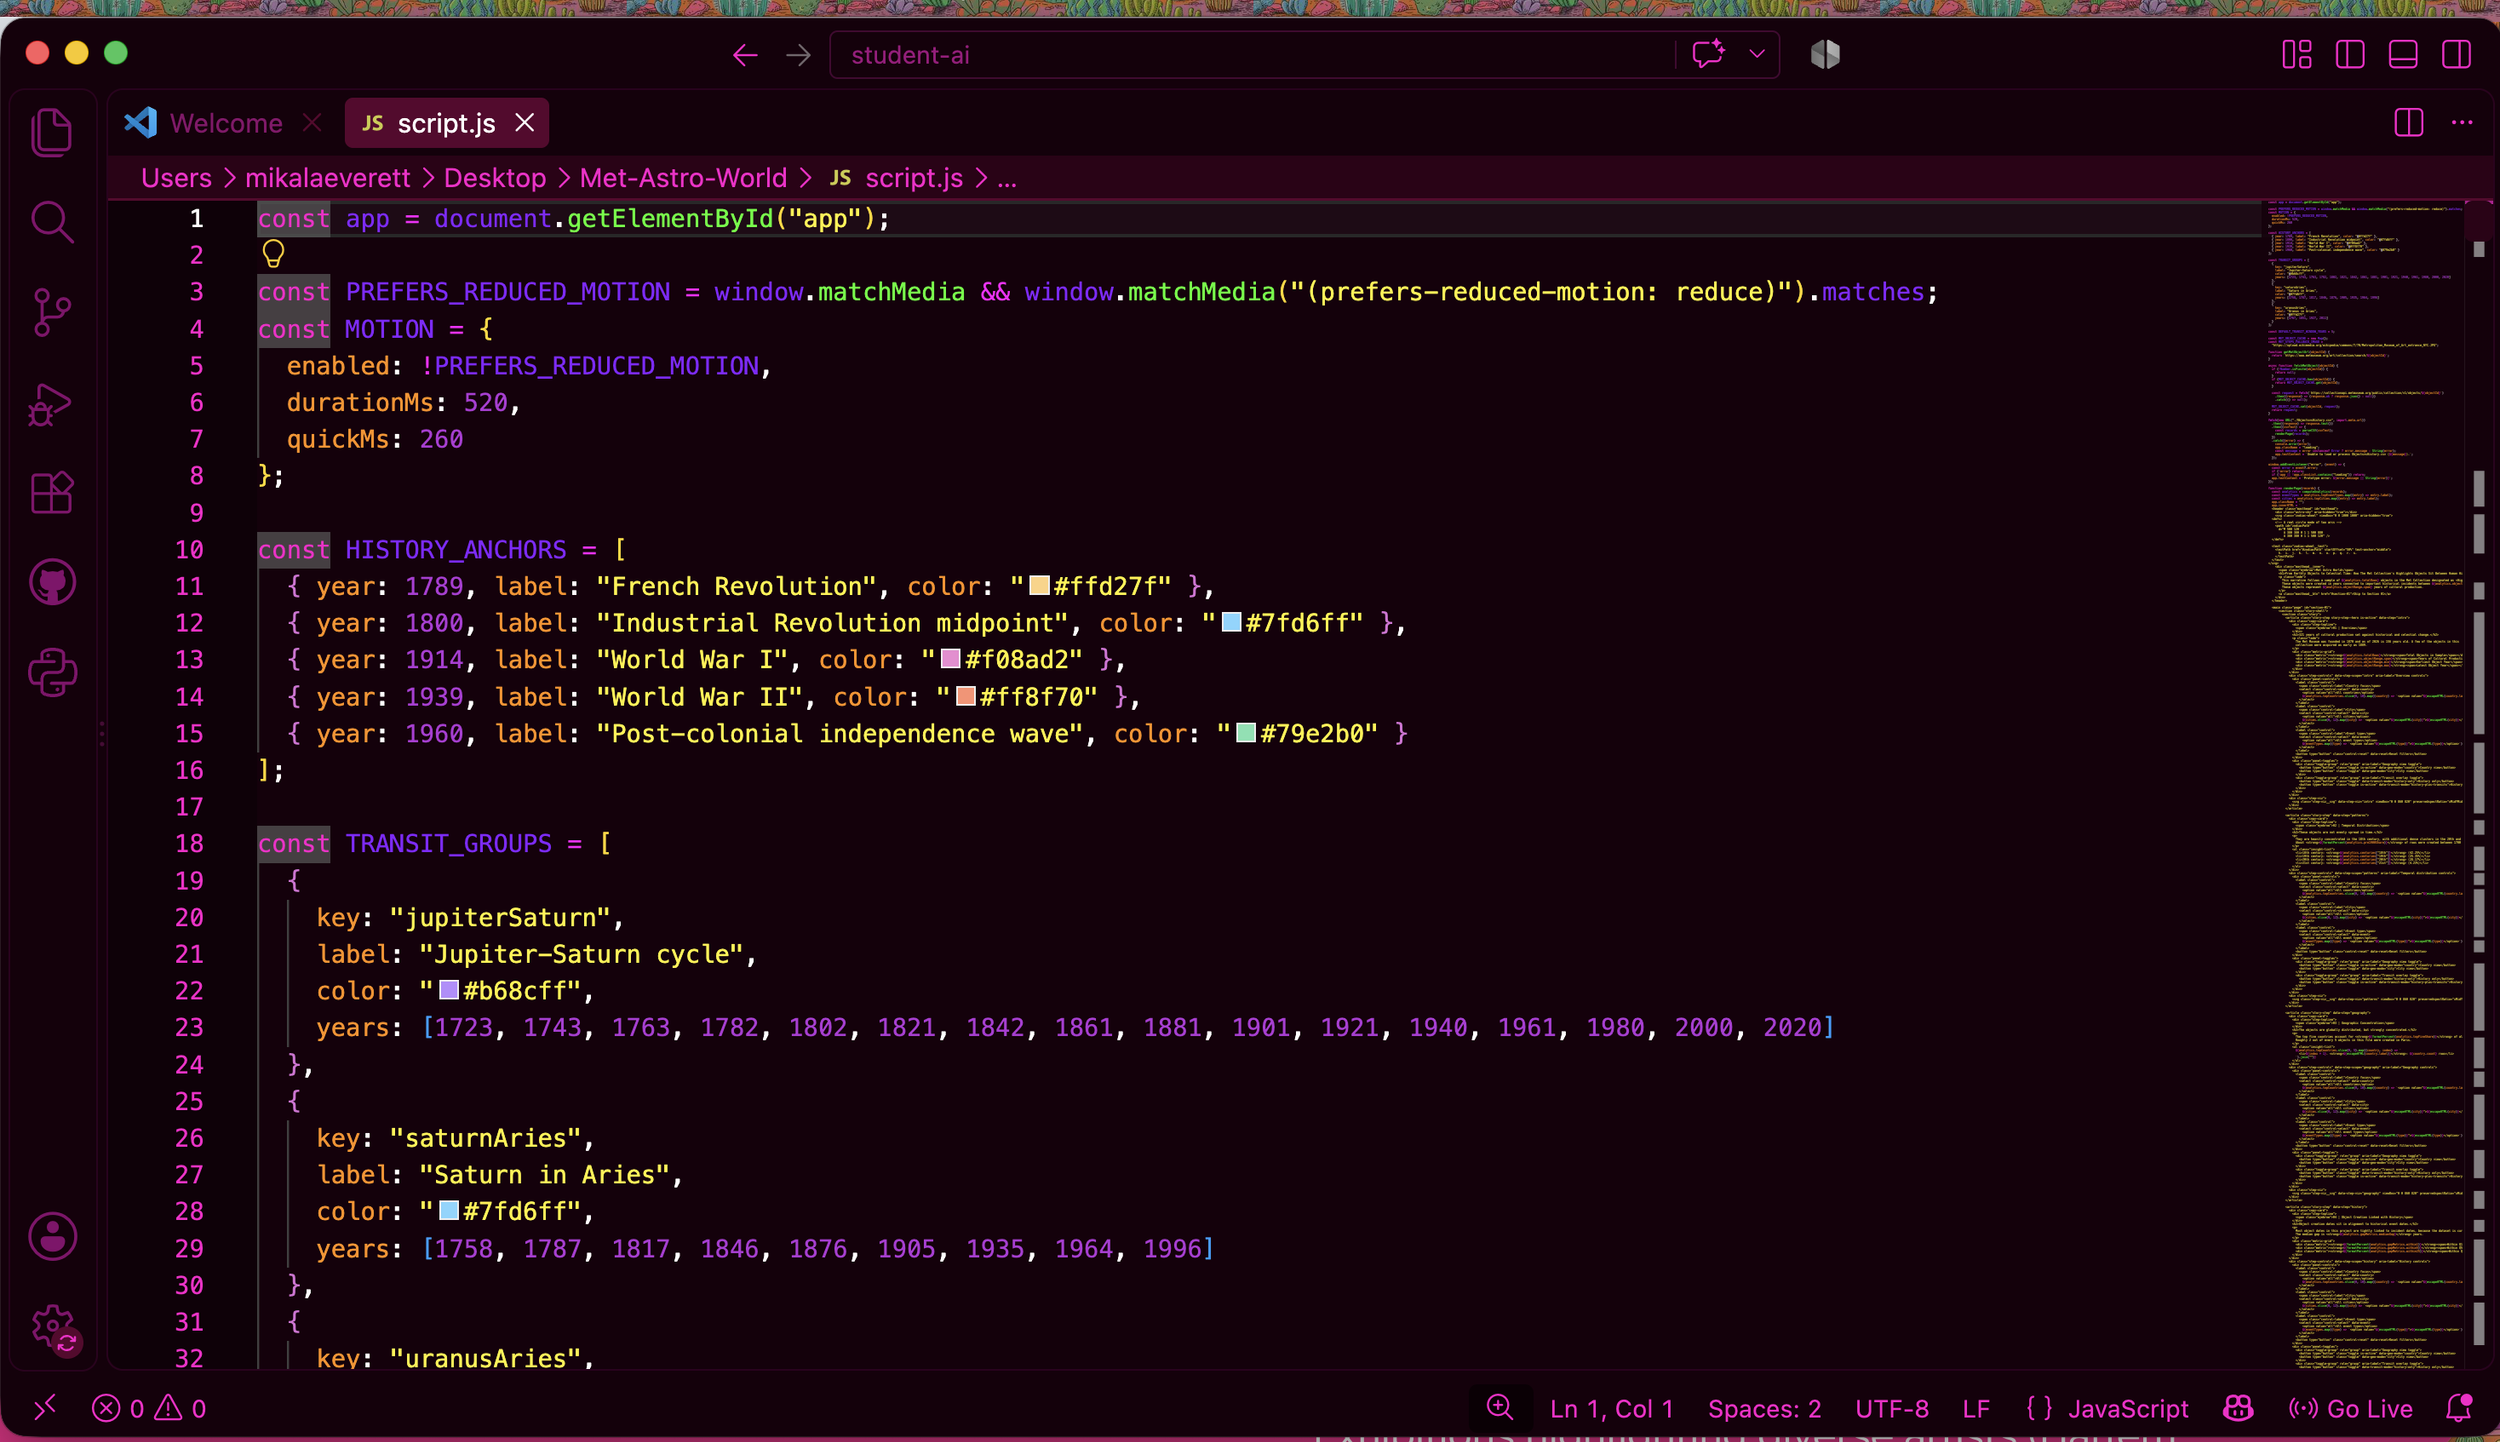
Using Digital Projects to Explore the Met API
Through this project, I was able to highlight some issues with cataloging, curation practices, and what designates an object as a highlight. These findings can be used in the future to improve the Met ApI.
Key Findings
The objects were heavily concentrated in the 18th century. About 65.73% of objects were created between 1700 and 1899.
Five countries account for 71.63% of all records: France, Germany, Italy, Japan, and India. The objects are greatly skewed to Western-centric origins.
Most of the object creation dates were tightly linked to incident dates.
These dates sit within long-term astrological transits.
Limitations
I greatly underestimated how much work and time this project would require.