UCS Programmatic Outcomes Report
This project compiles data from NYC United Community School Directors to analyze long-term programs in our school communities.
Programs are defined as outside providers or services that United Community Schools (UCS) brings into the school through a Community School Director.
Tools Used:
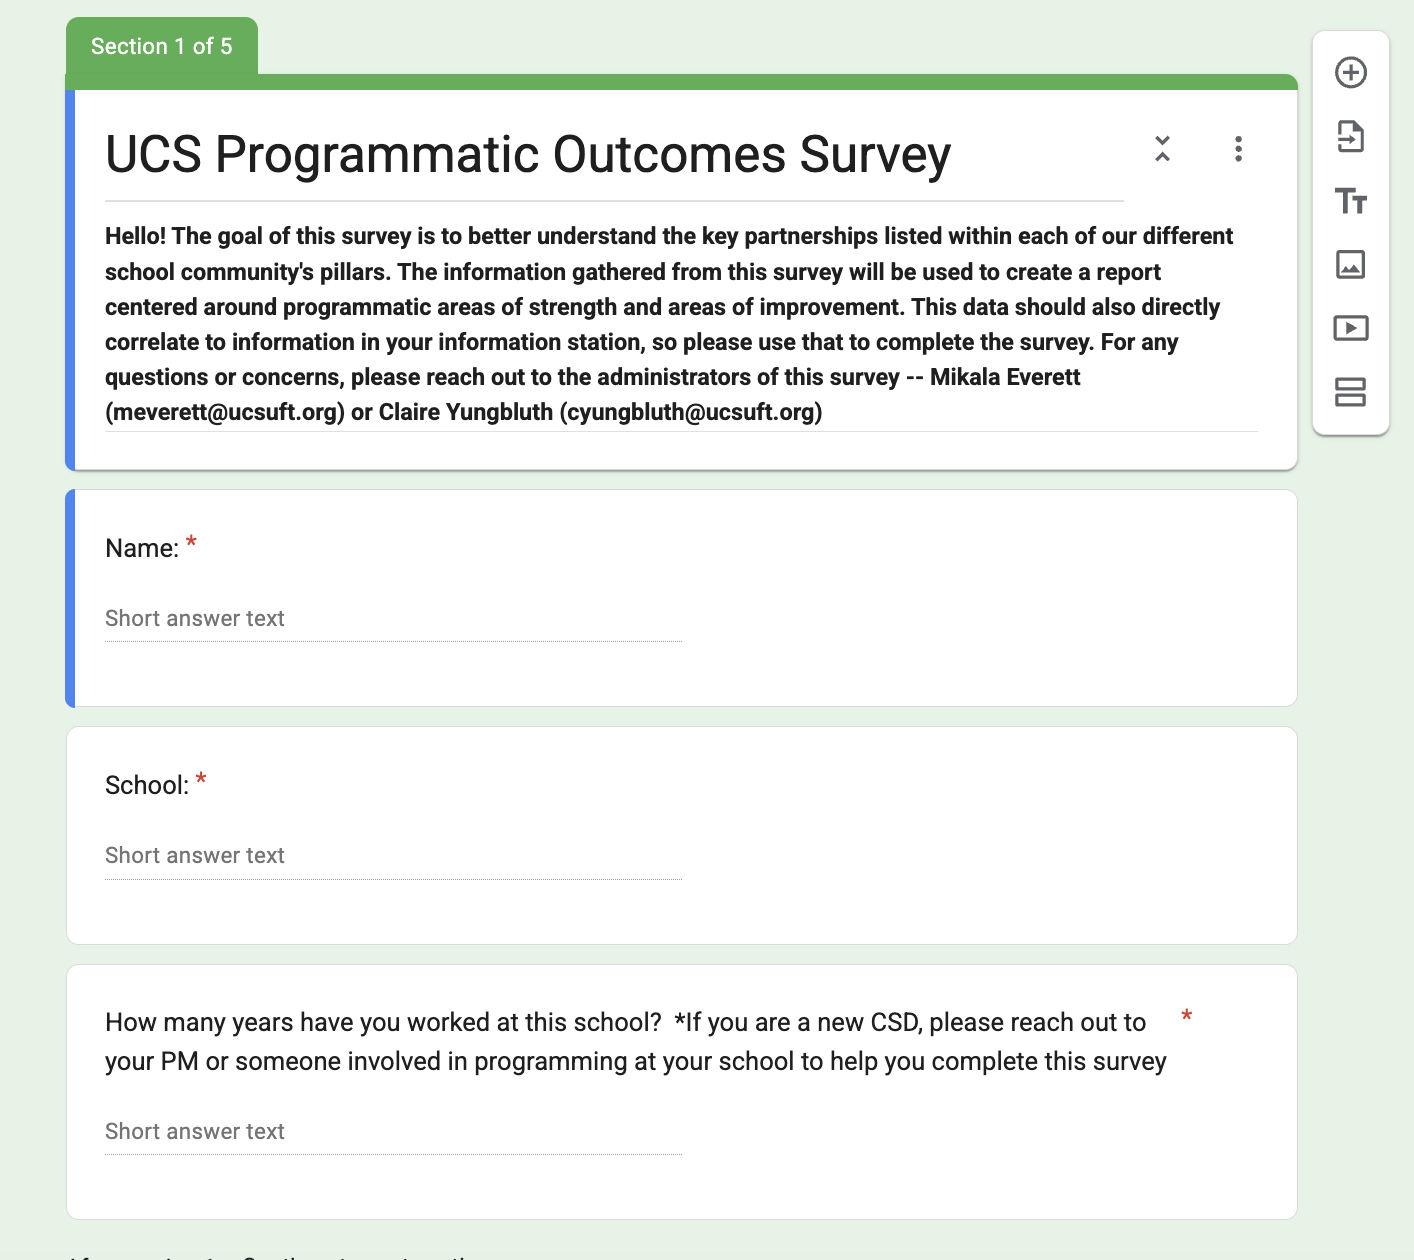
Google Forms → survey
Google Sheets → data cleaning
Data Studio → dashboard and visualization creation
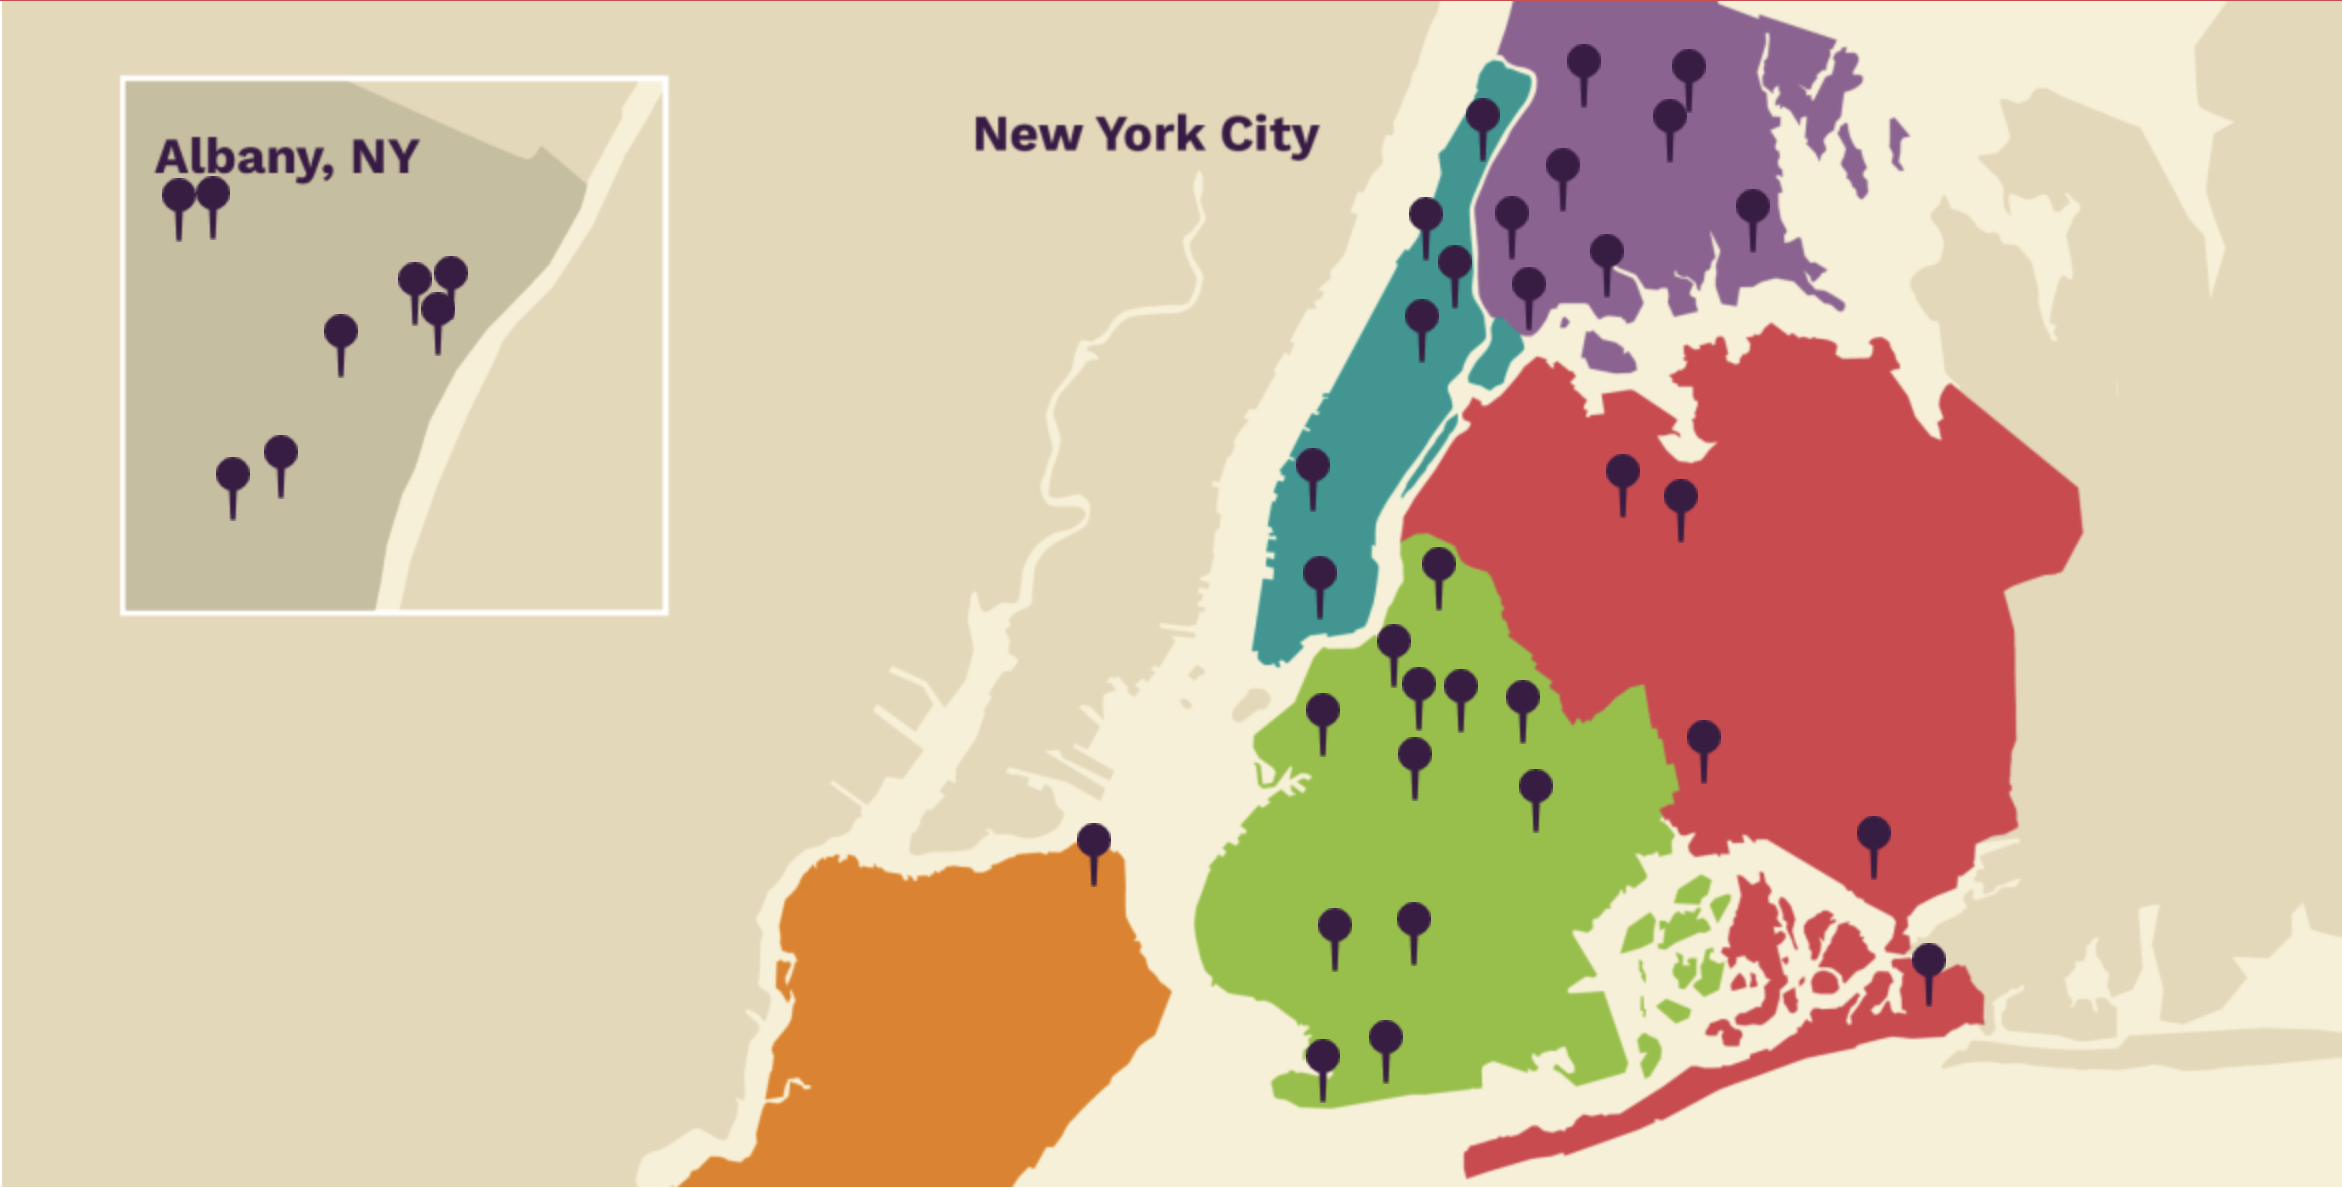
There are 32 UCS Schools in NYC. I created a survey to evaluate which programs were at each school and how long those programs and CSDs were at the school in 2025.
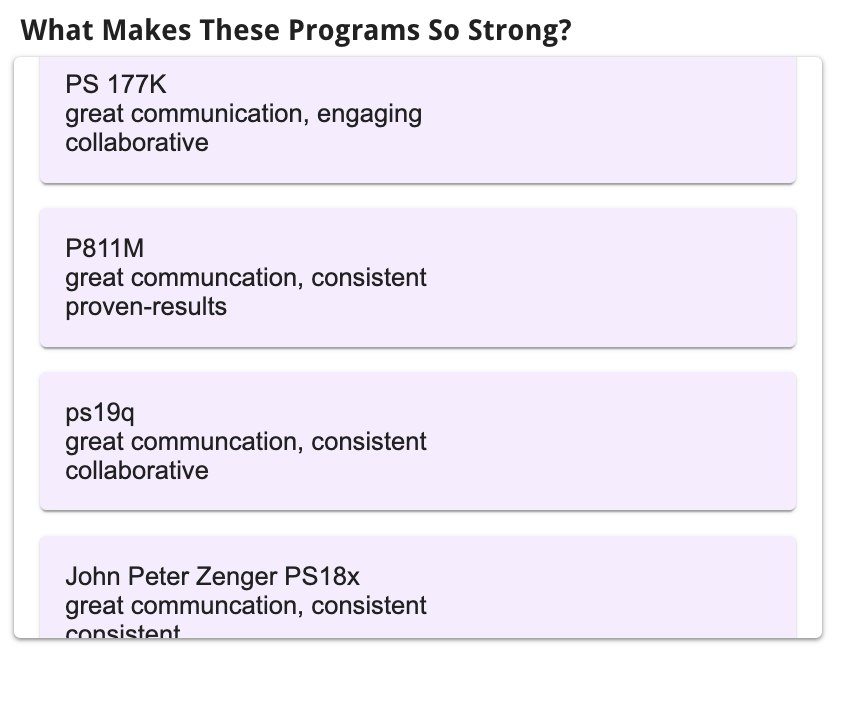
After sending out the survey through Google Forms and receiving responses from all NYC CSDs, I cleaned the data for both visualization purposes and to create keywords associated with the programs from the lens of the CSD.
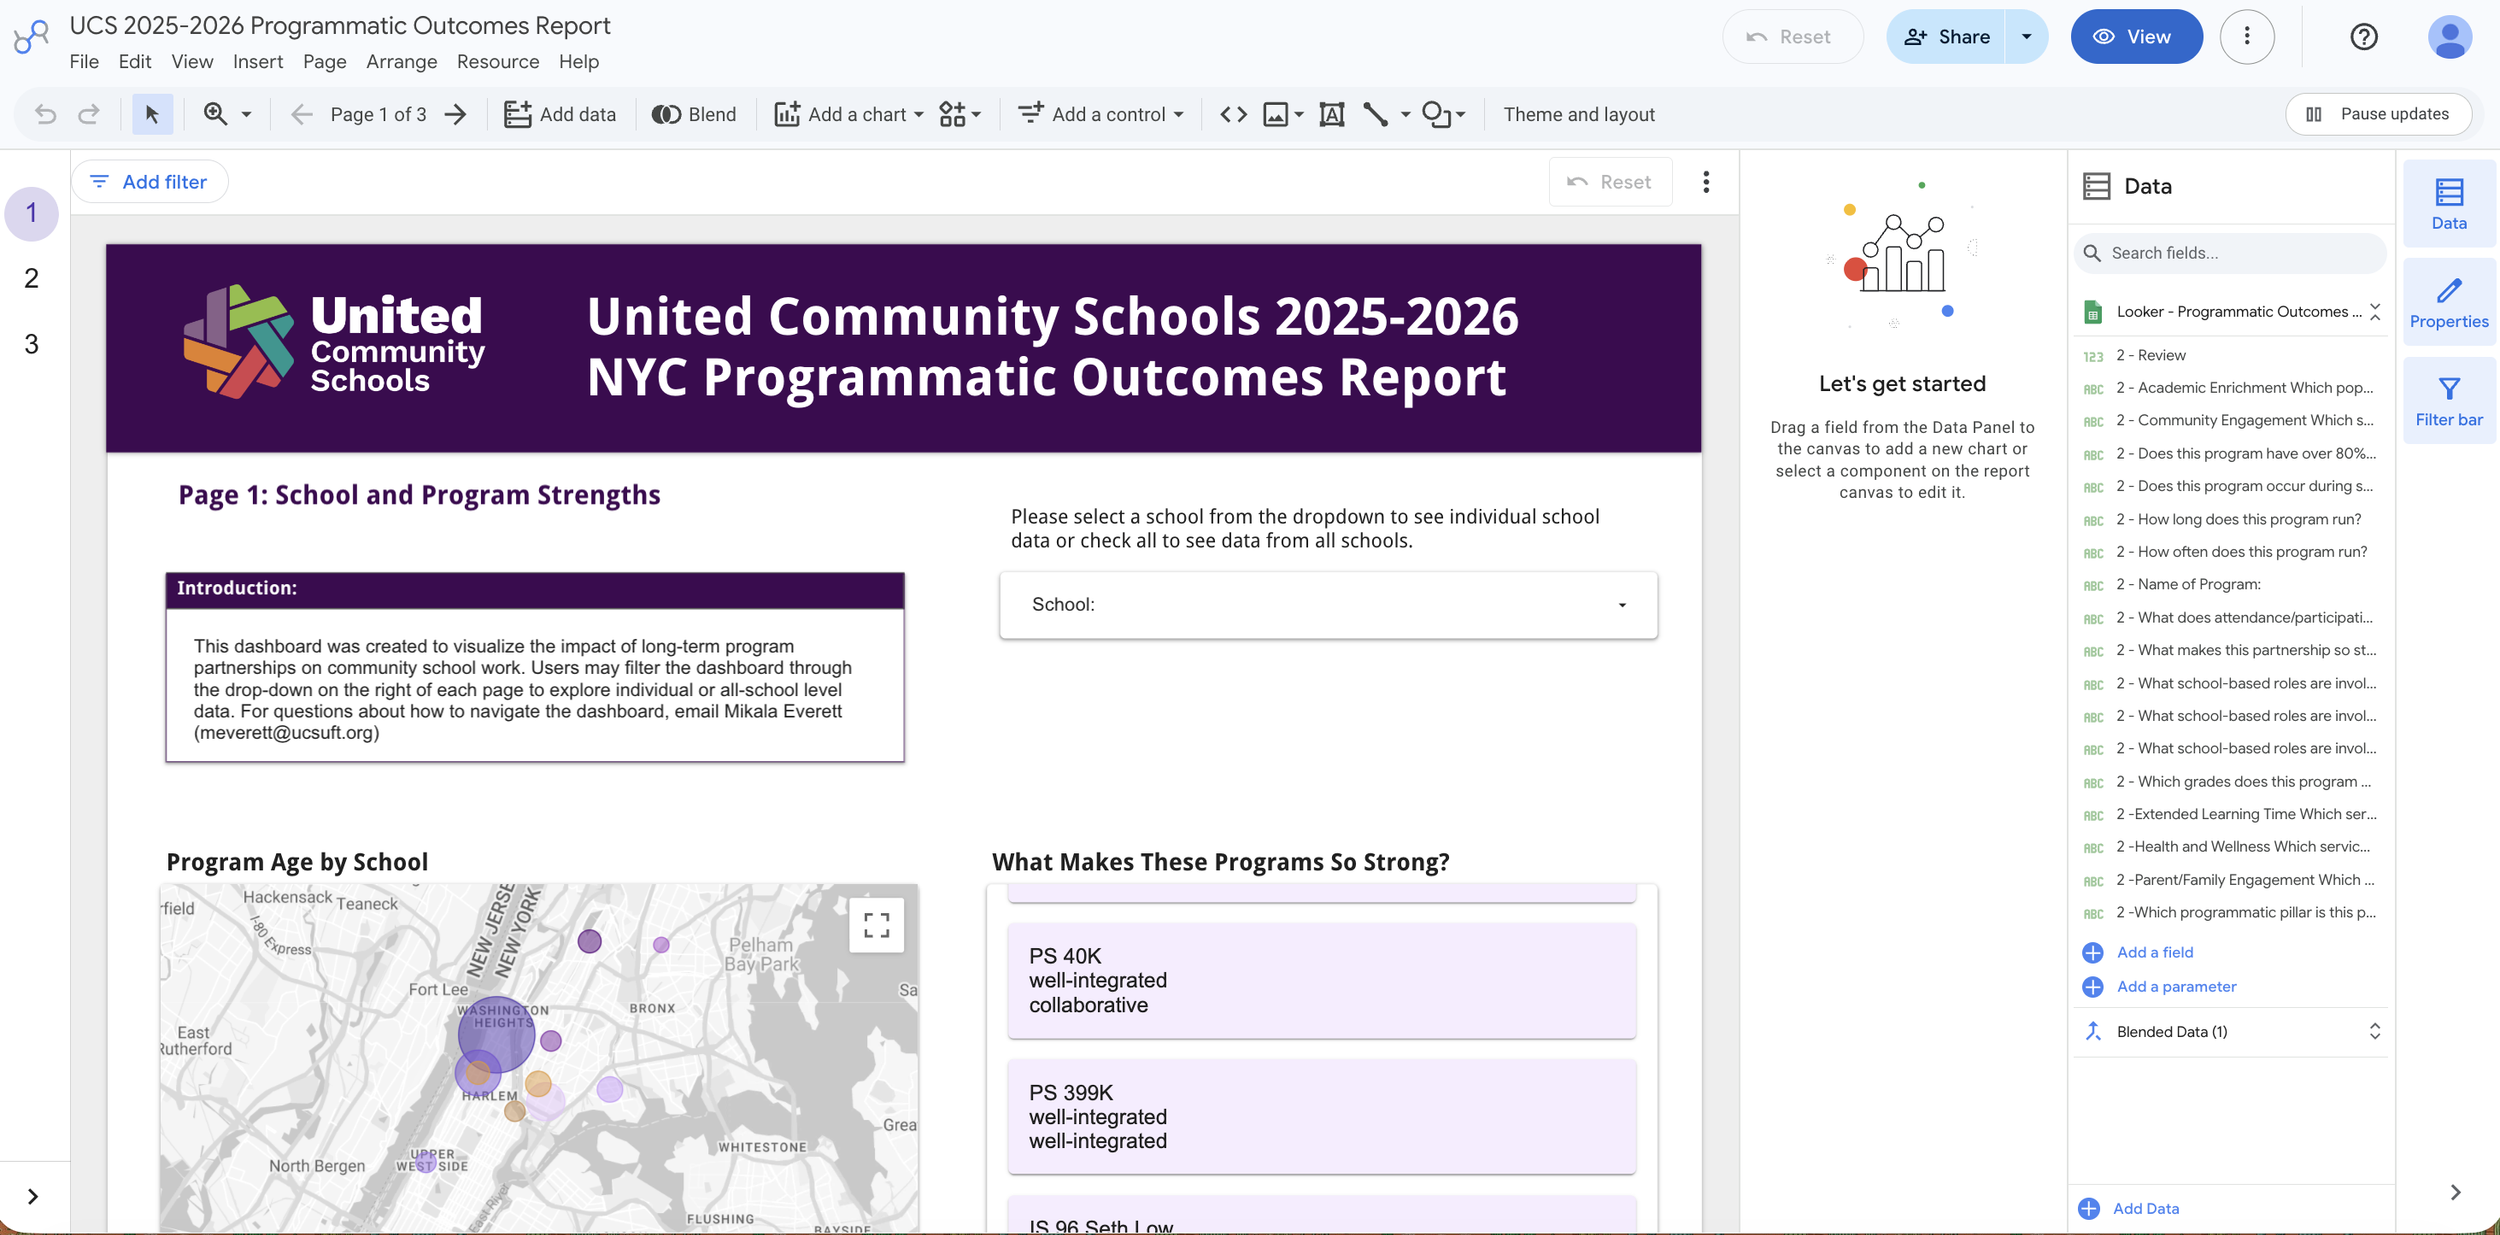
I then connected the cleaned Google Sheets to Google Data Studio and built out the report through multiple visualizations and pages.
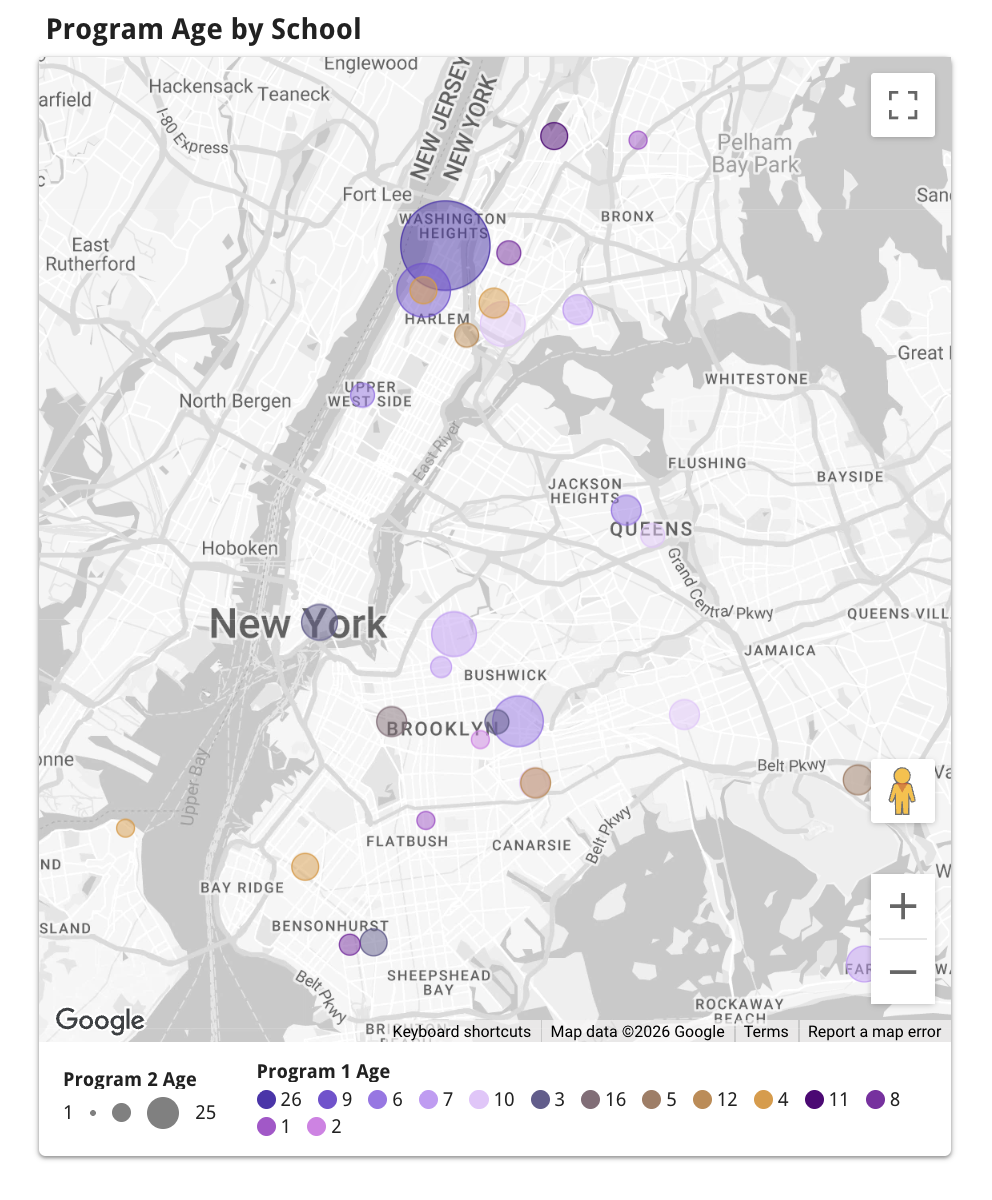
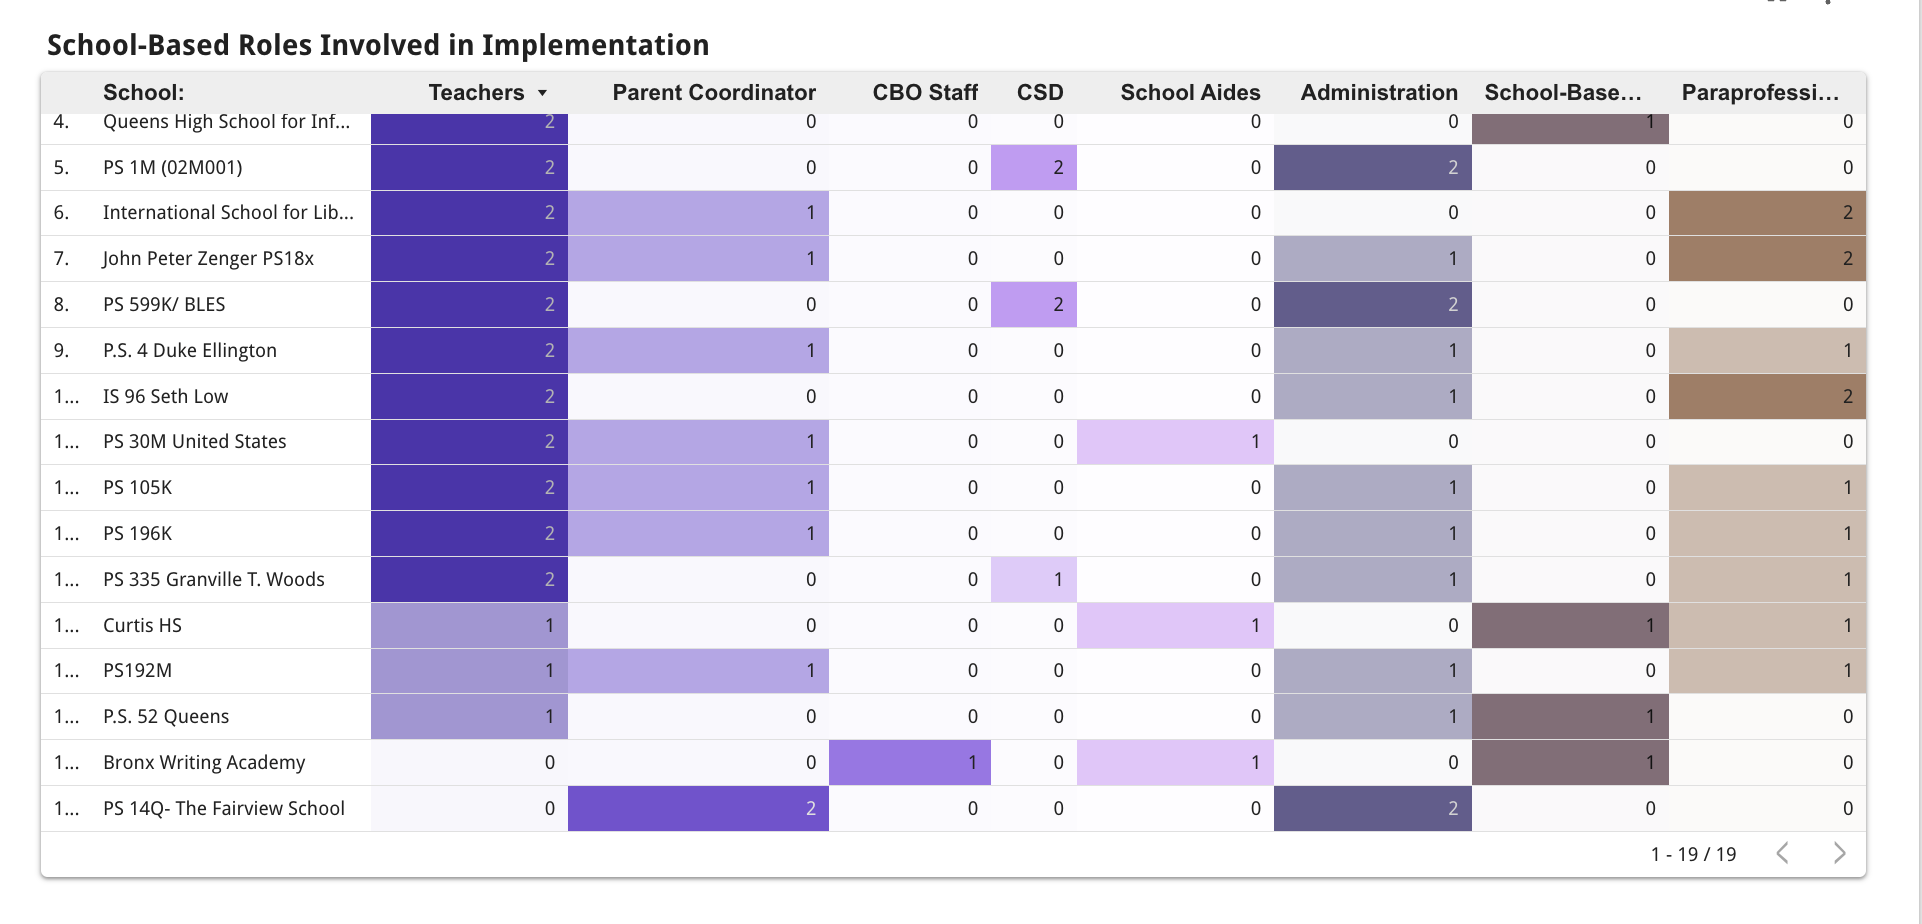
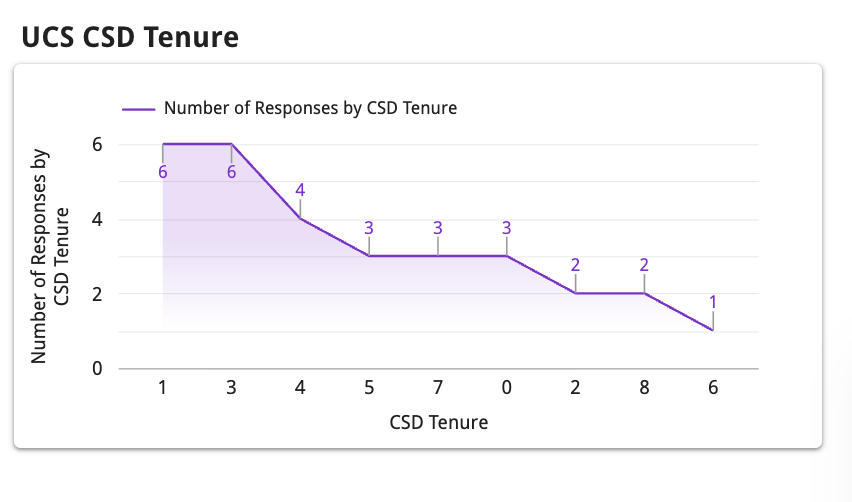
Page 1 explored program age by school, program strengths, CSD Tenure, and school-based roles involved in the implementation of the program.
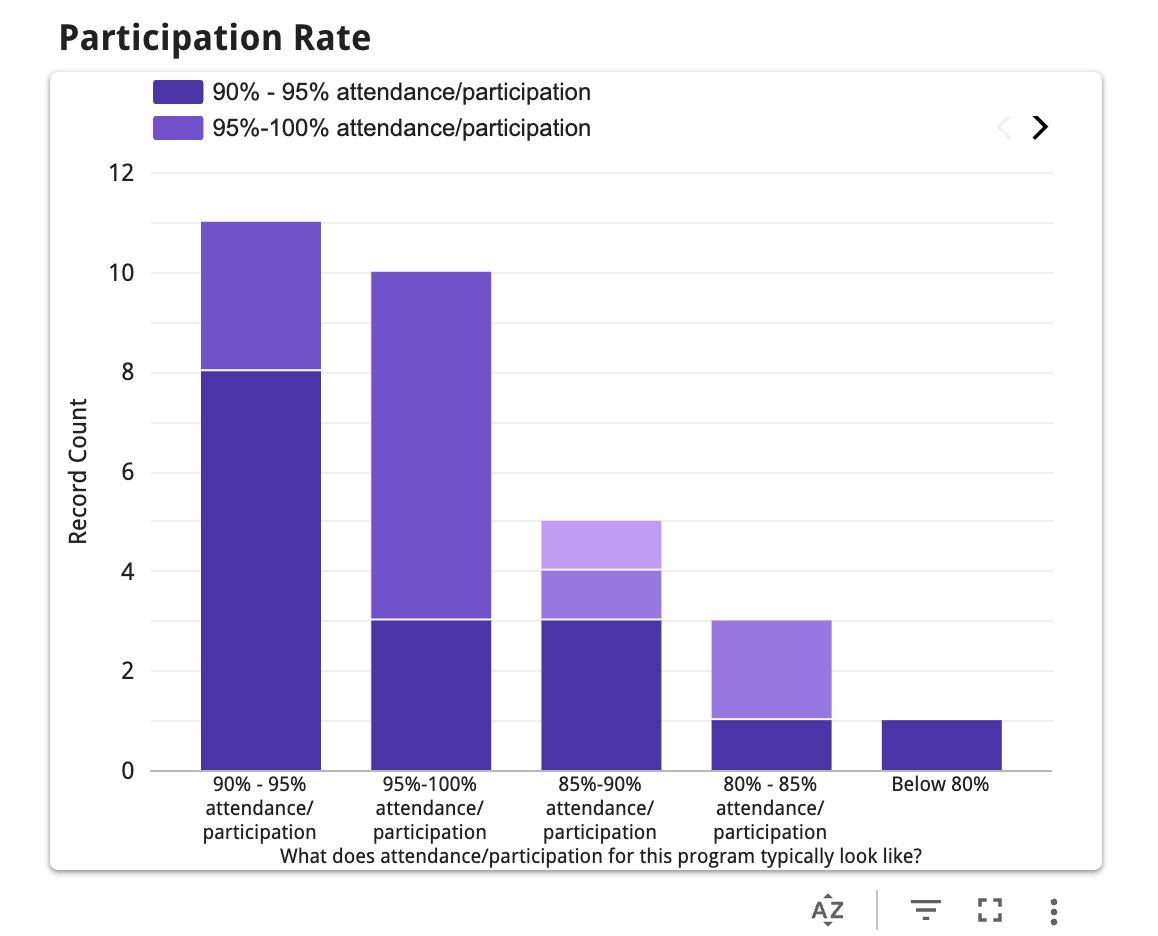
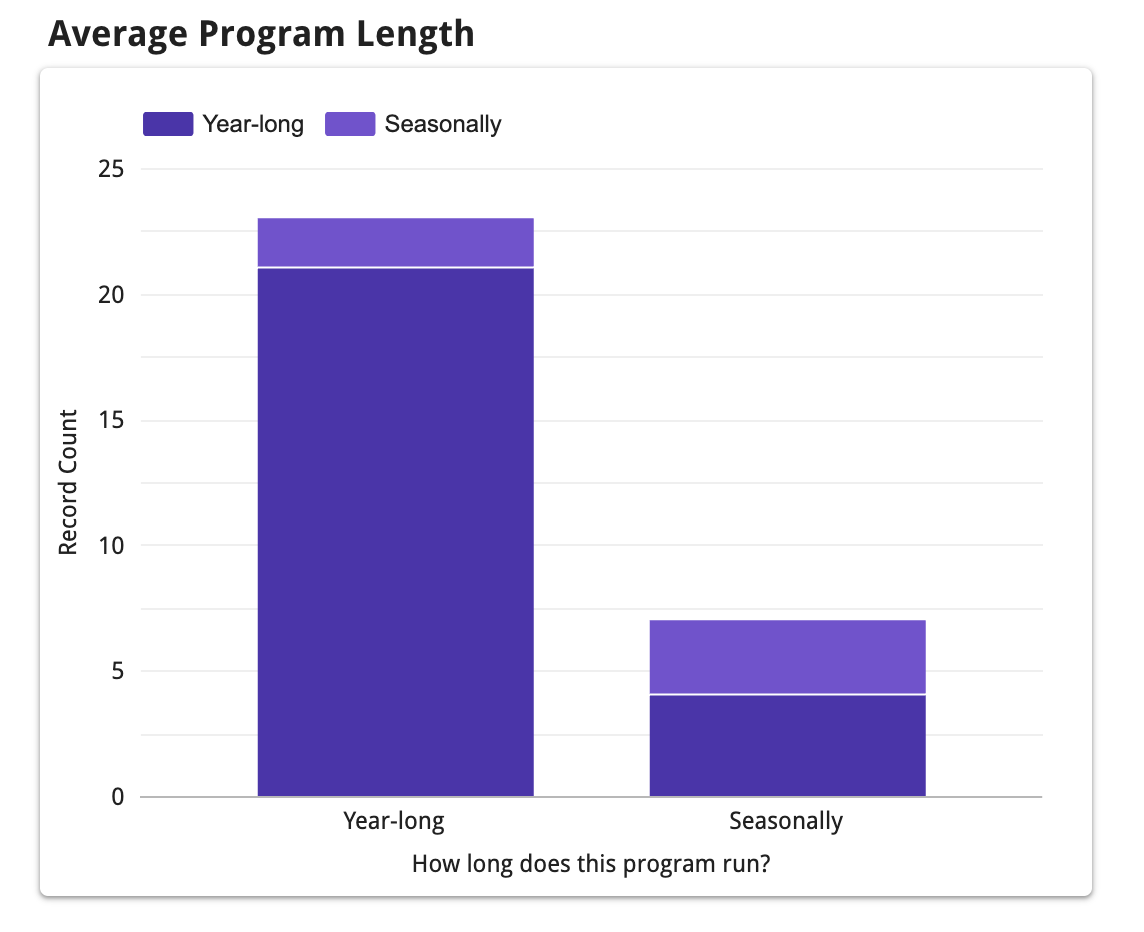
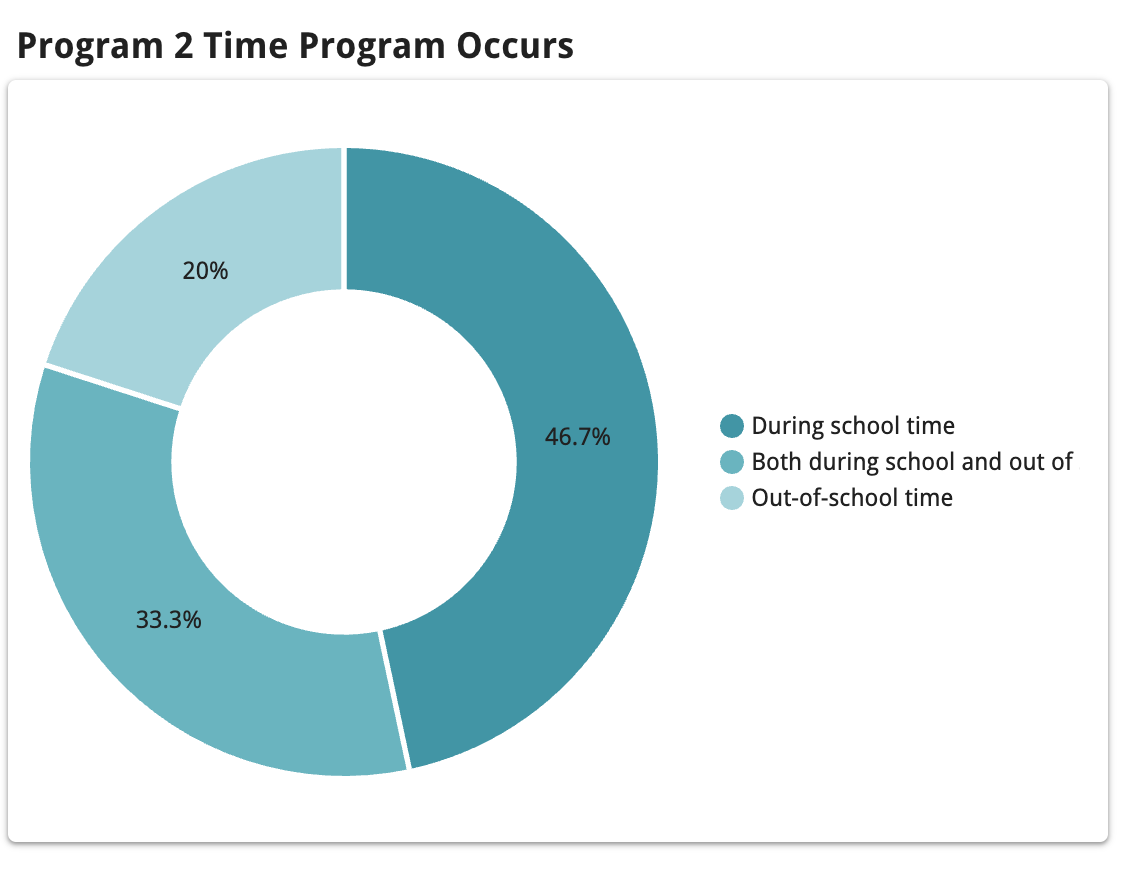
Page 2 explored grades served, participation rate, average program length, how often programming runs, and when it occurs.
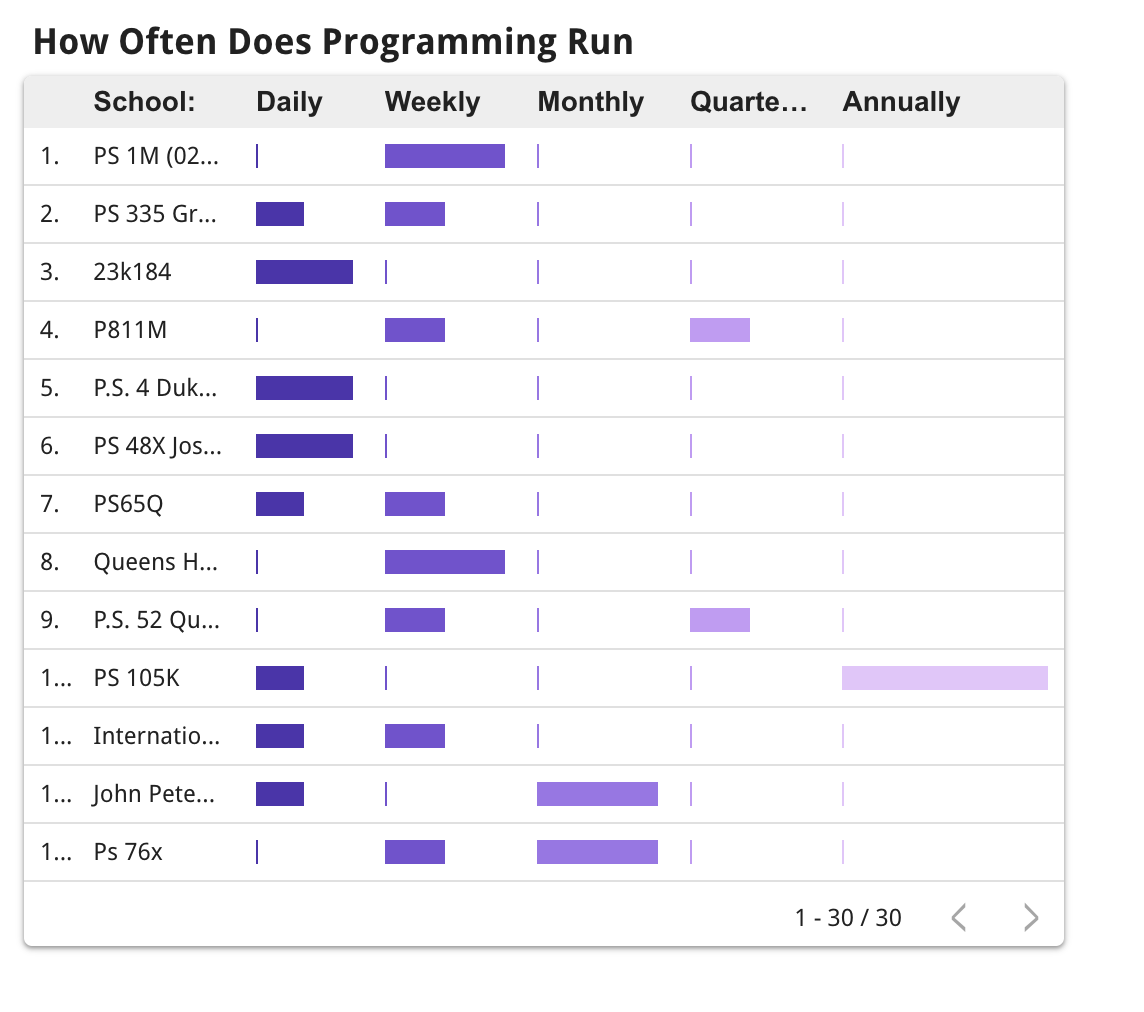
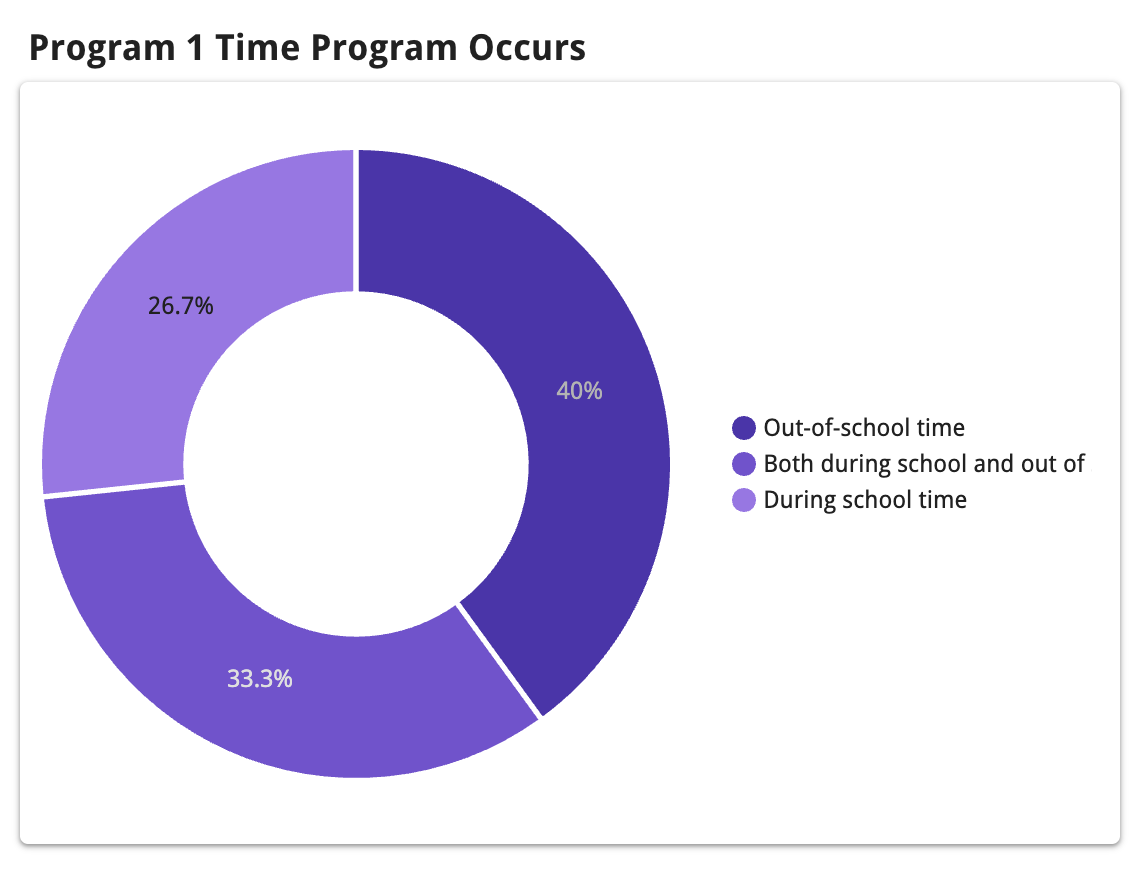
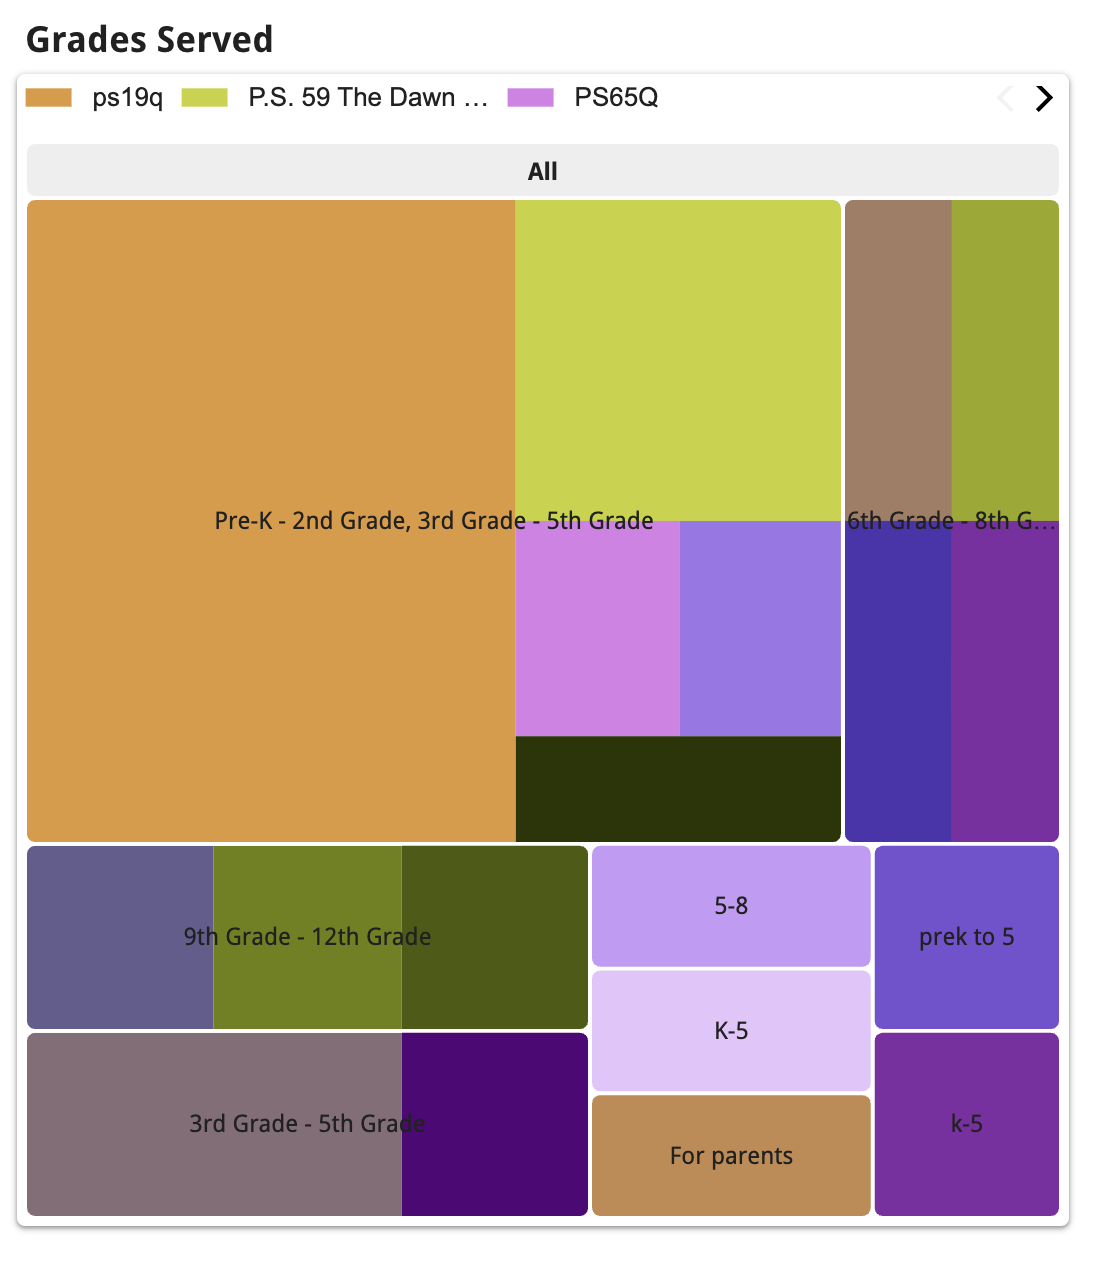
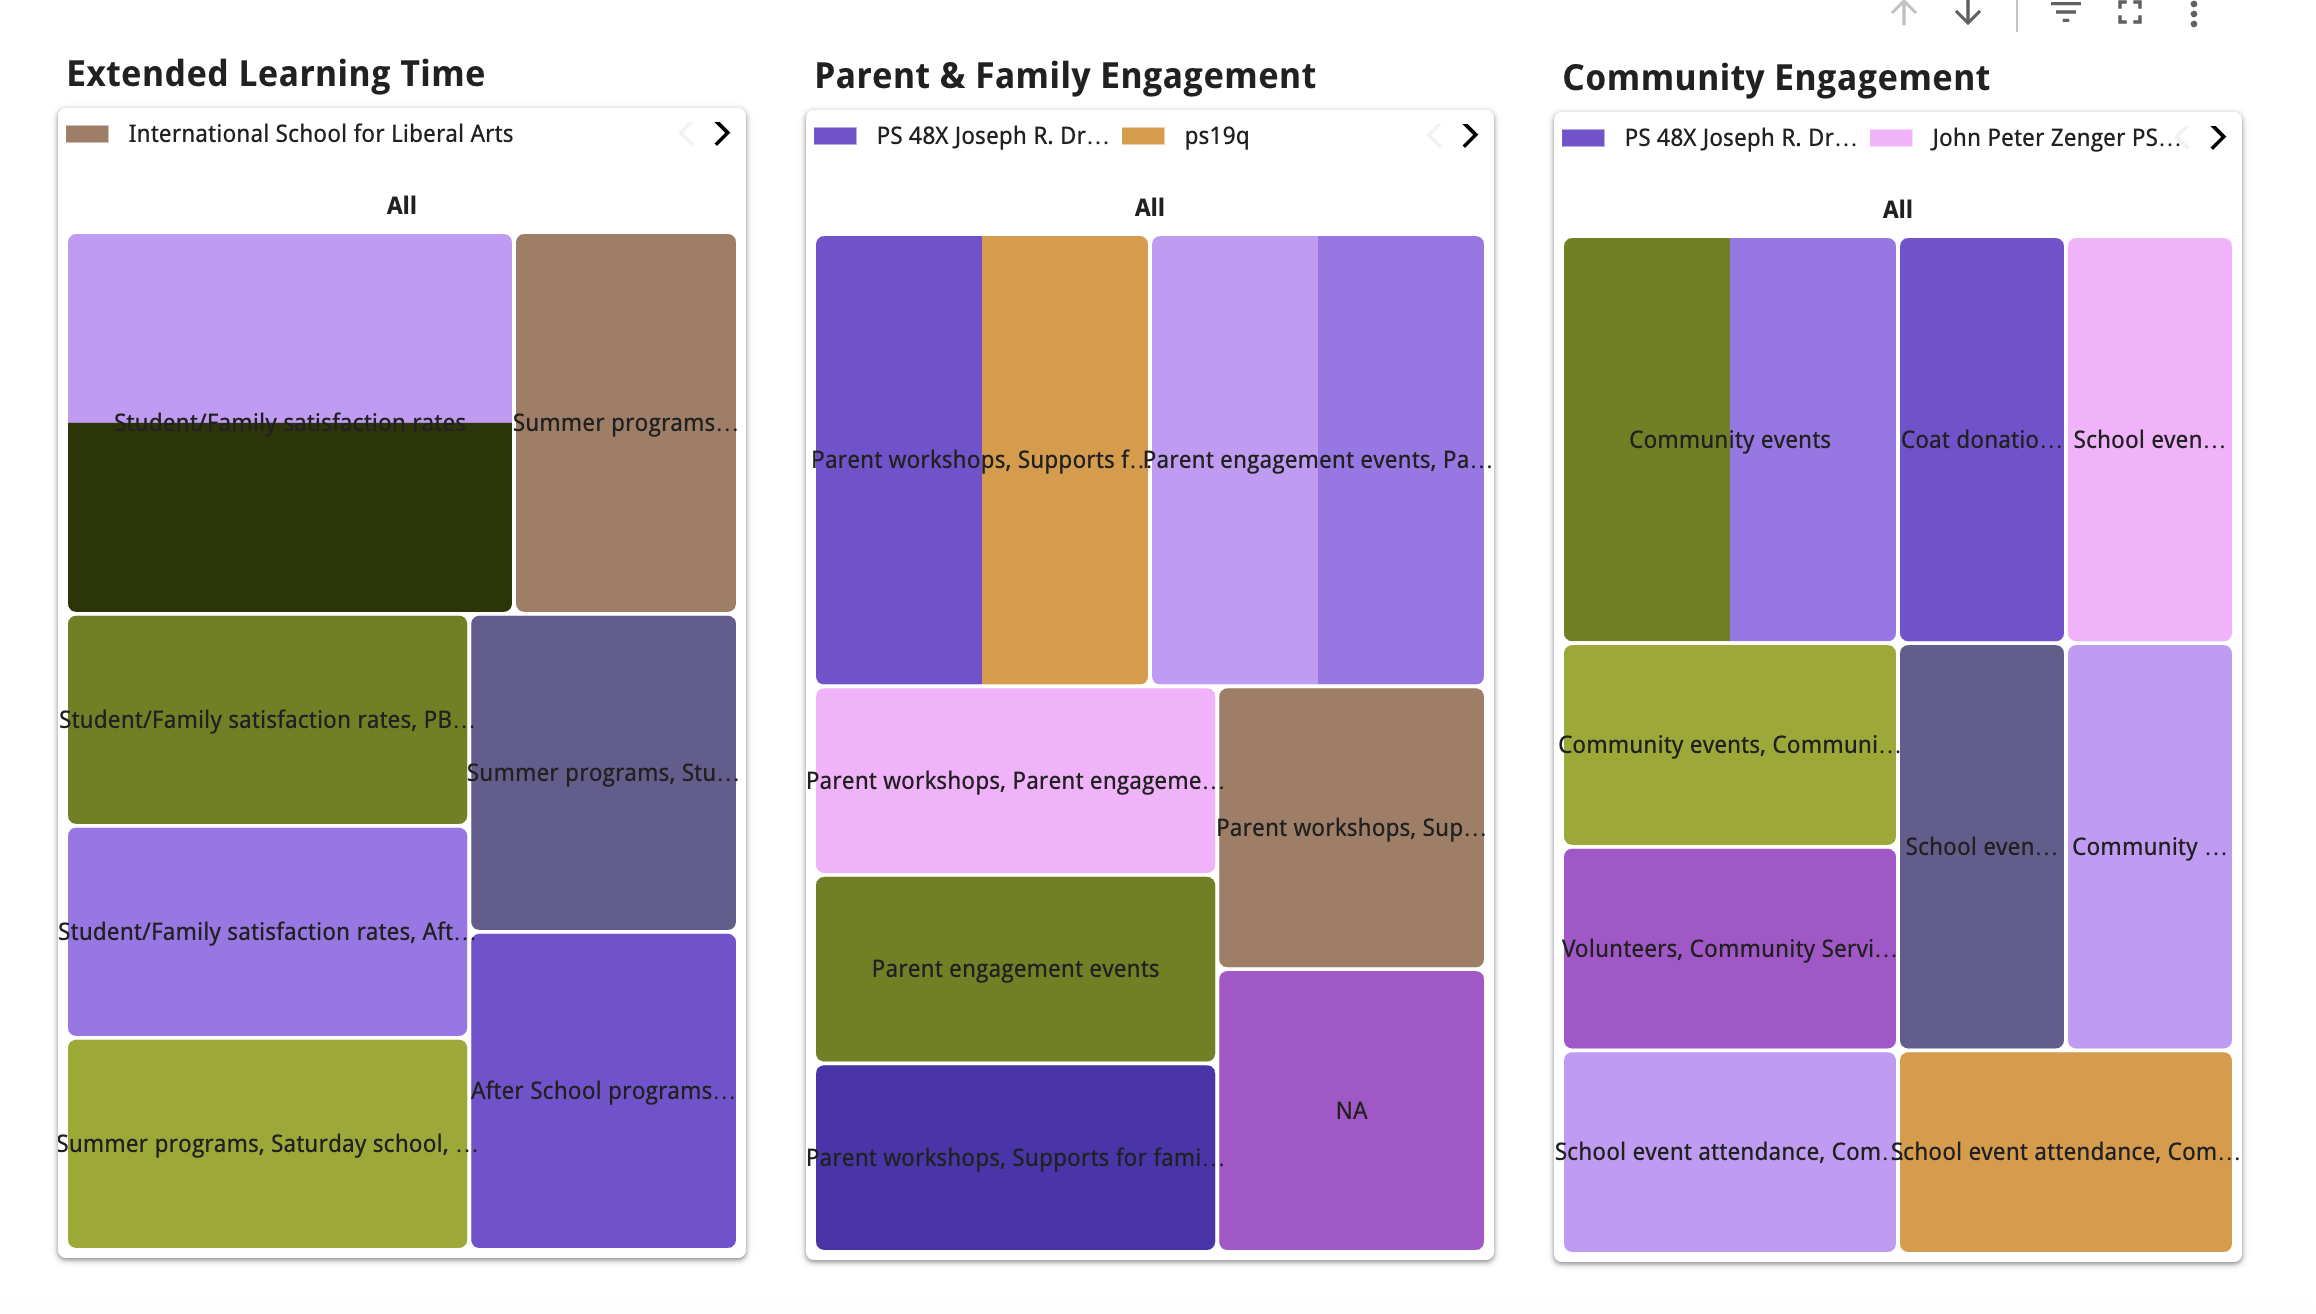
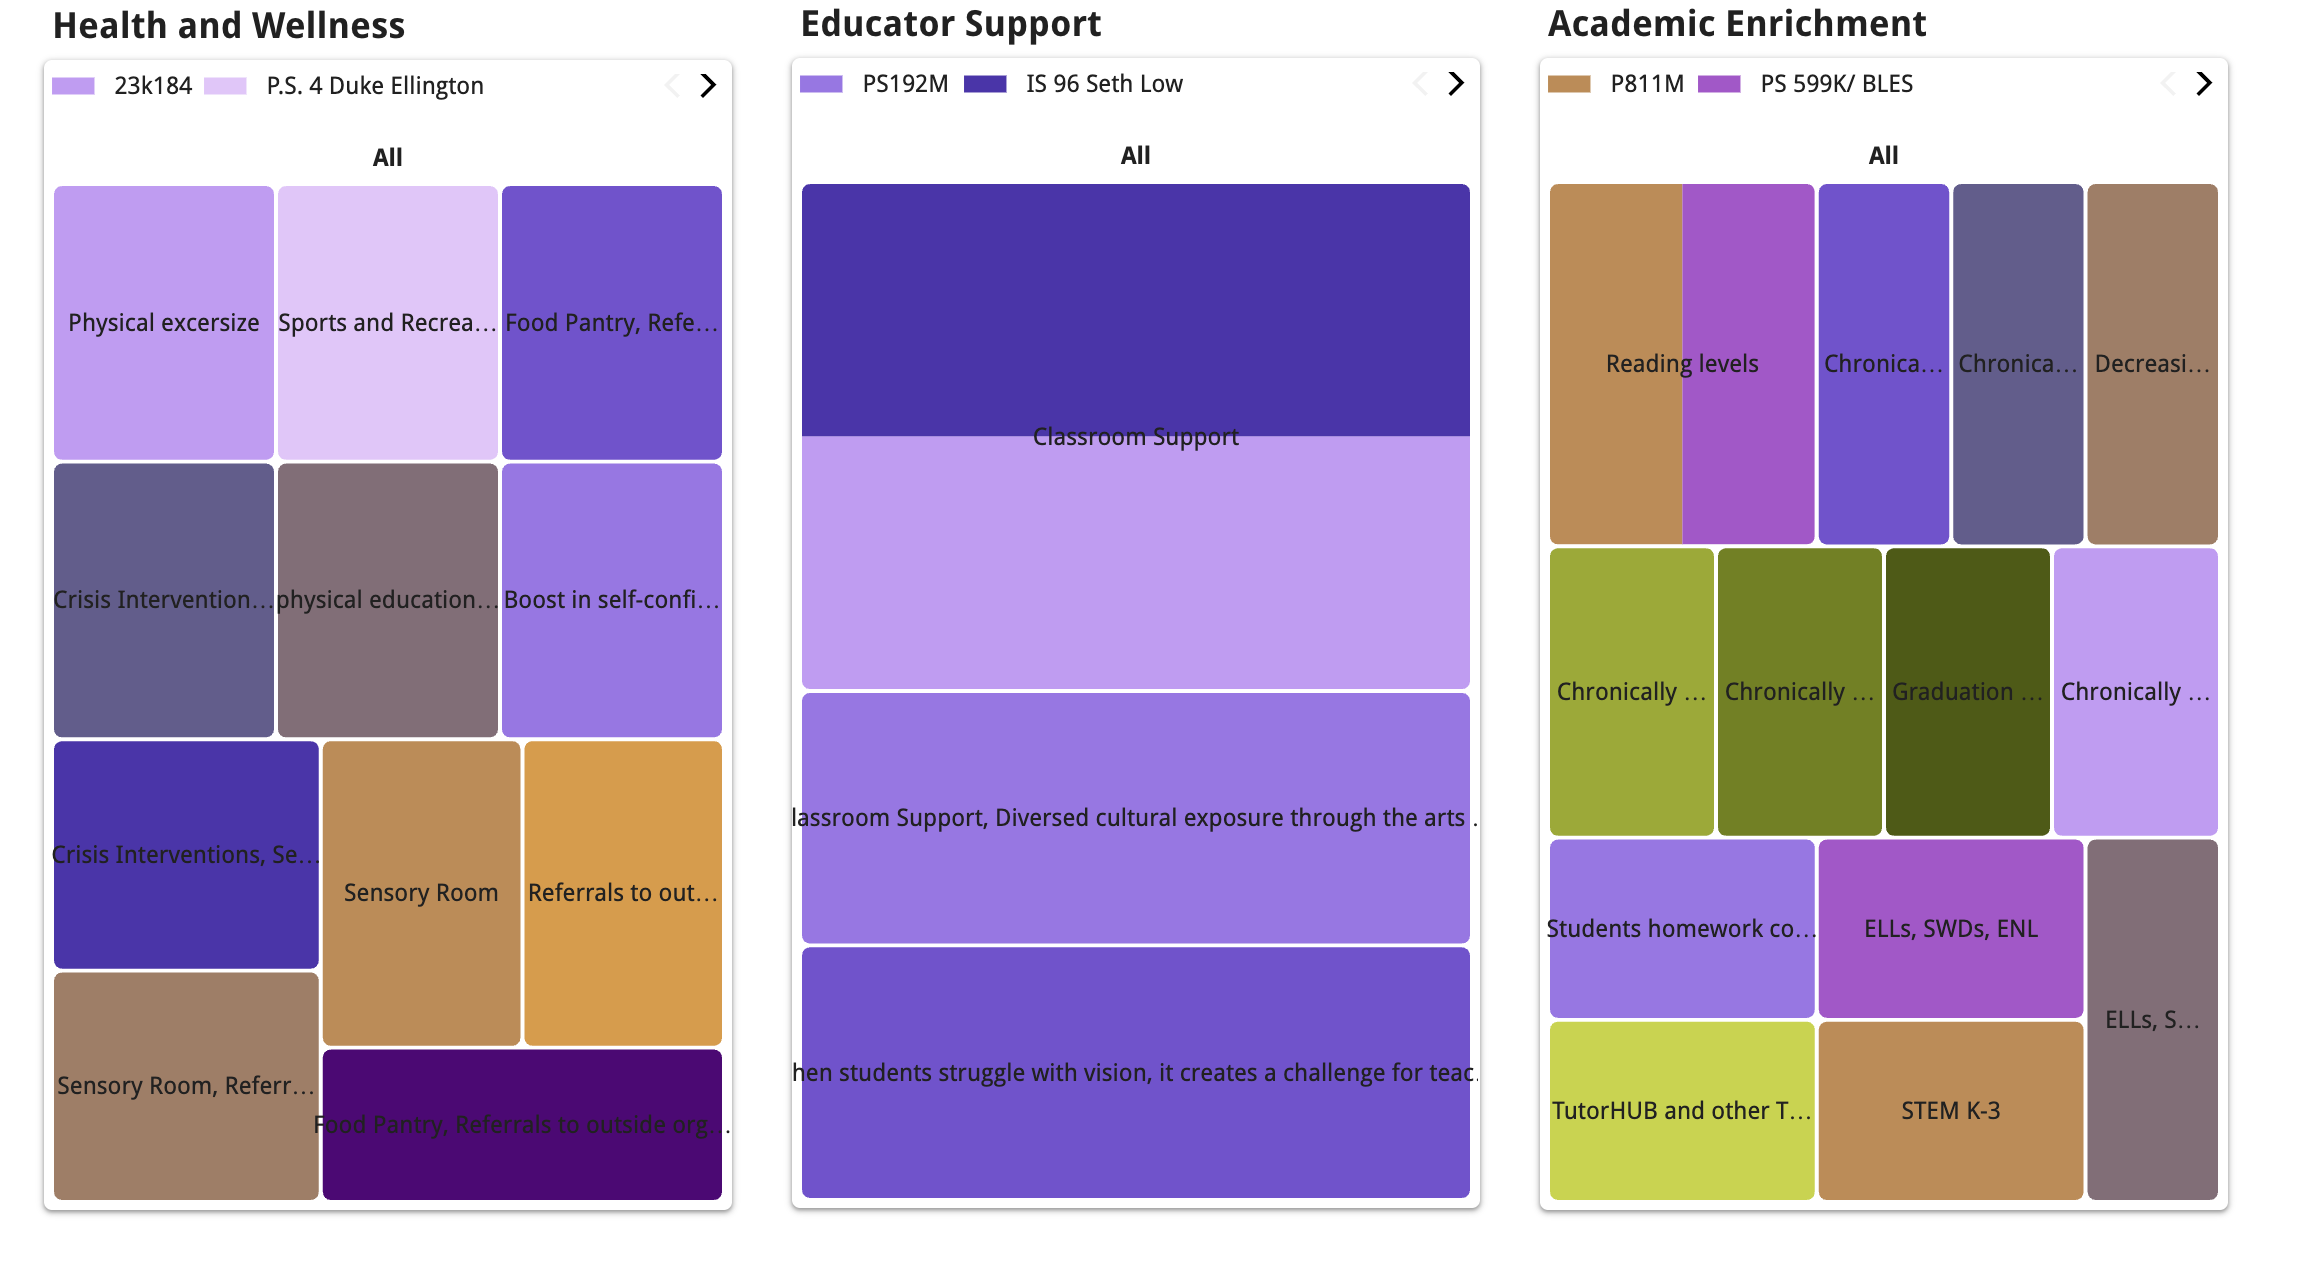
Page 3 examines which of the six UCS pillars the programming targets. UCS’s model is built on the principle of targeting six areas of enrichment in a school: health and wellness, academic enrichment, educator support, extended learning time, parent and family engagement and community engagement
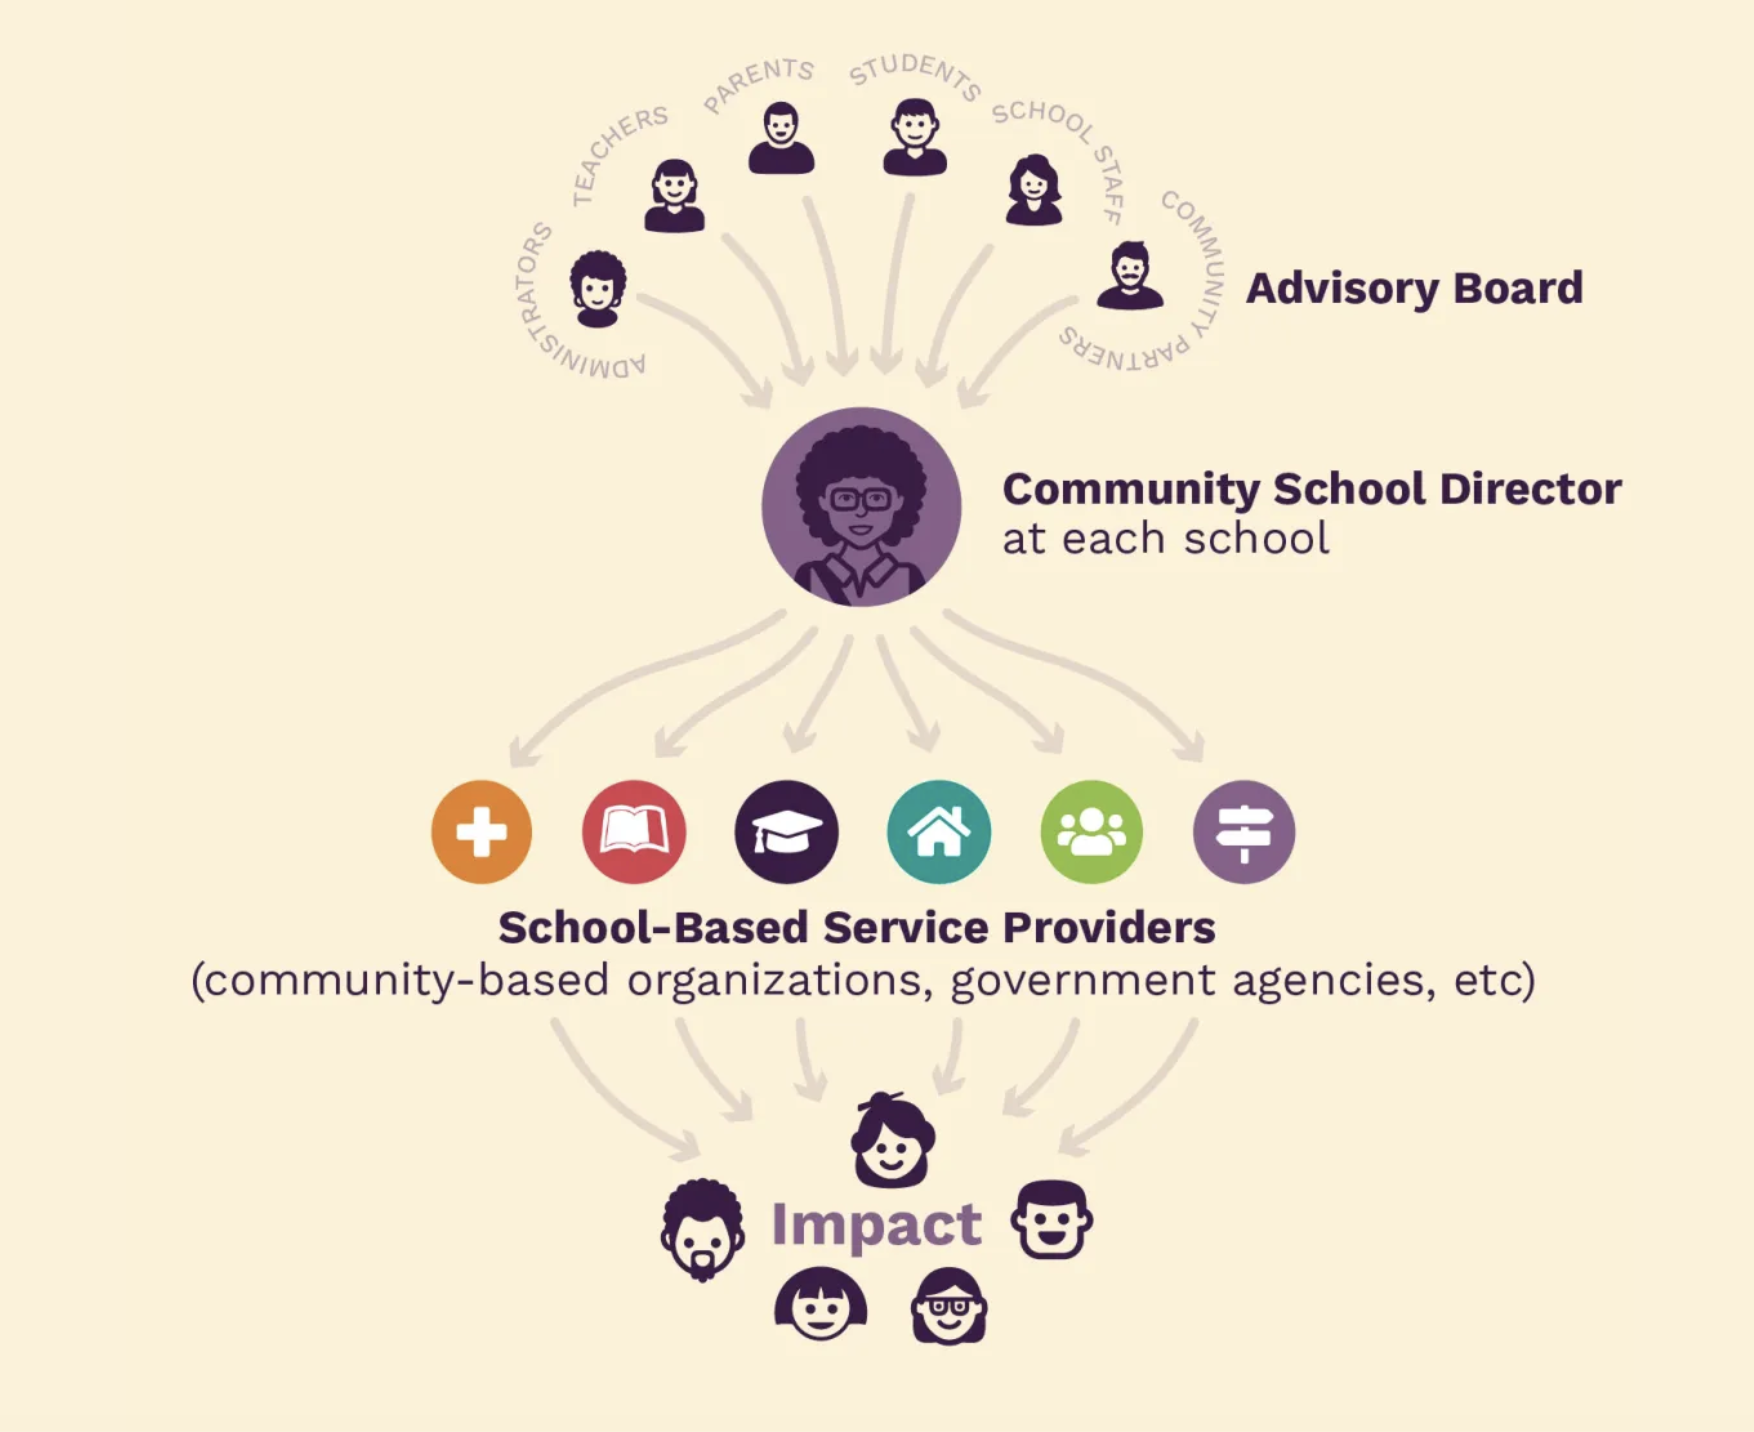
This report was shared out with UCS leadership and presented to my fellow CSDs in conjunction with a programming activity in a workshop.
Because this report was created with use by UCS leadership and CSDs in mind, the visualization and interaction choices were made with that in mind. CSDs possess many skills and are pulled in many directions, so a simple, easy-to-use dashboard-style report was the best way to display the data.
I learned how to use Data Studio through my Digital Analytics fellowship at The Met.
You can view the entire report here.
Key Findings:
These programs have sustained so long because they share key characteristics: they are well-integrated, collaborative, and have proven results.
The programs with the highest program age are at schools with high CSD tenure.
Successful programs involve many different school-based roles in order to be succesful with teachers being the most collaborative role.
Majority of the programs served elementary schools and were present at the school on a daily or weekly basis.
Most of the programs occur both outside of school time and during school time.
Average attendance is high in these programs with 90-95% attendance in both programs submitted by the CSDs.
These programs often target more than one pillar, with health and wellness and parent and family engagement being the most targeted pillars.
Limitations
Since this data was reported by CSDs in the school, not all schools had CSDs that were at the school long enough at the time of collection to confidently speak to the success of programming
The only data used was strictly from survey data and did not include any DOE gathered data